DQI reporter
DQI reporter releases:
Introduction:
We have various releases of DQI reporter. Basically, Derrick would extract json format files from raw APR reports. Based on Derrick’s json files, I’ll create html report file based on Shizhu’s spec.
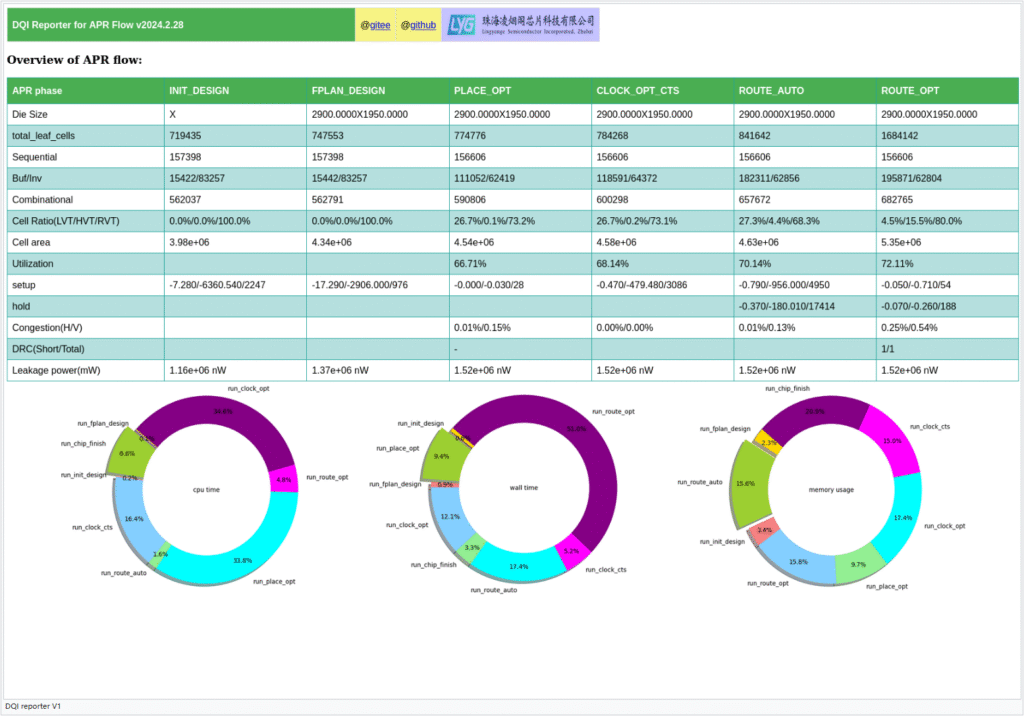
Version 1:
This is an initial version. There are only a few data available for an outline of APR design. However, it still could offer designers with a heads-up. The snapshot of a typical html report is shown below:
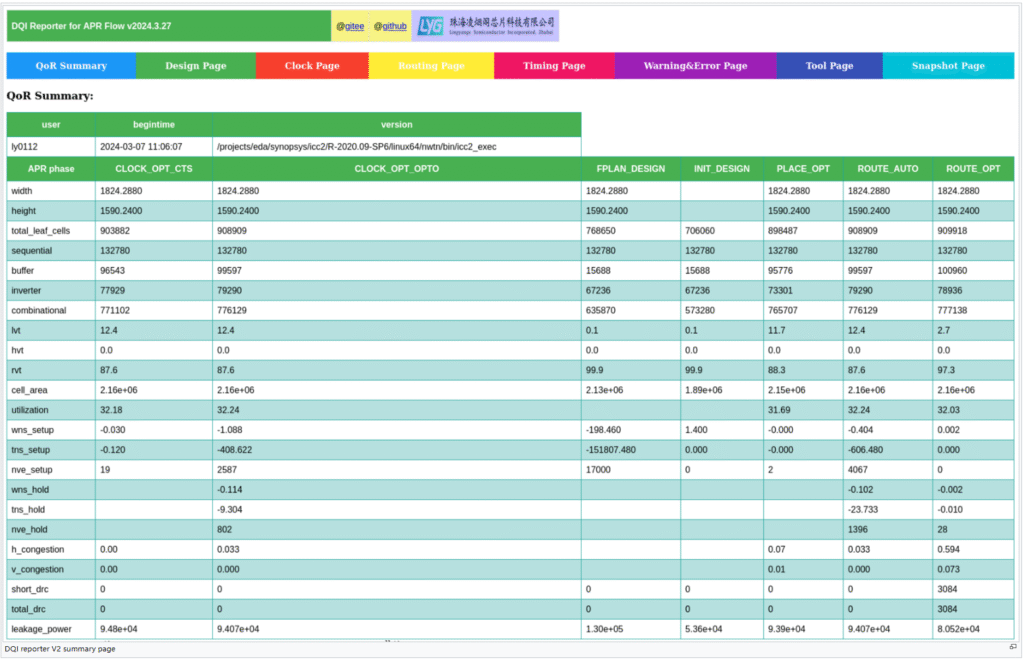
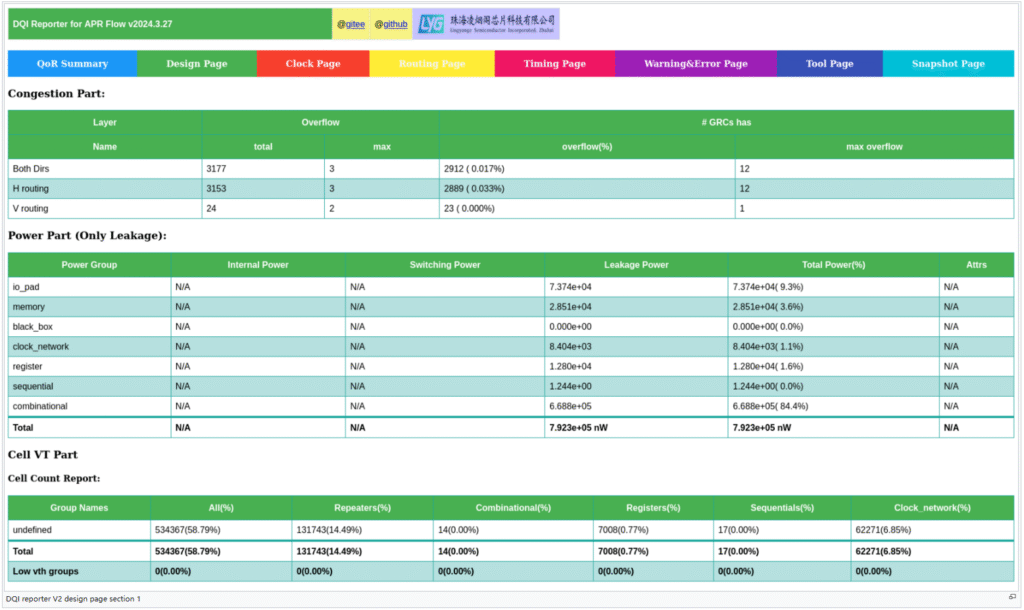
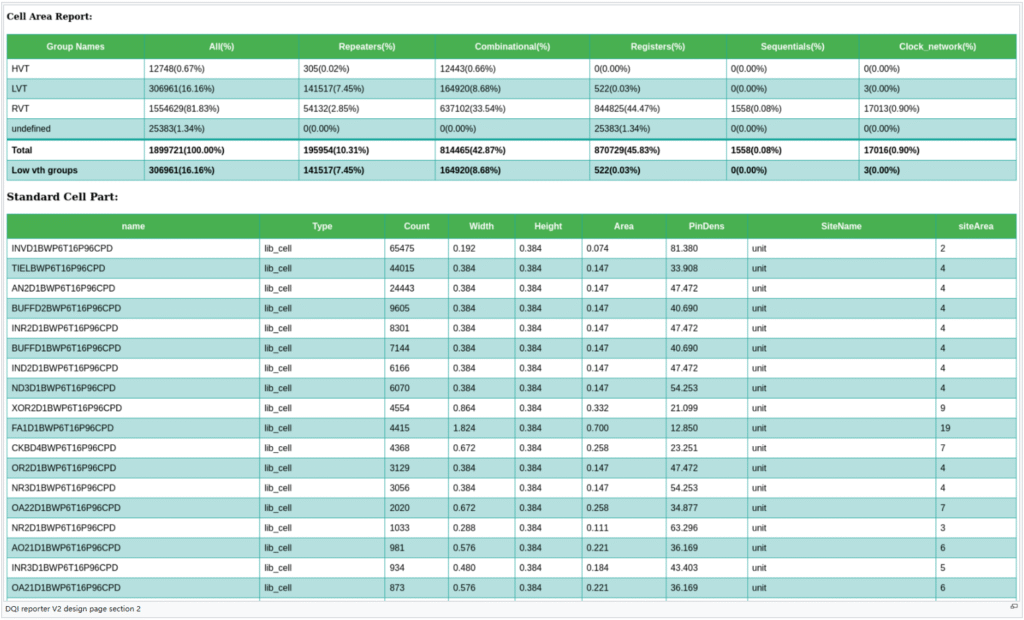
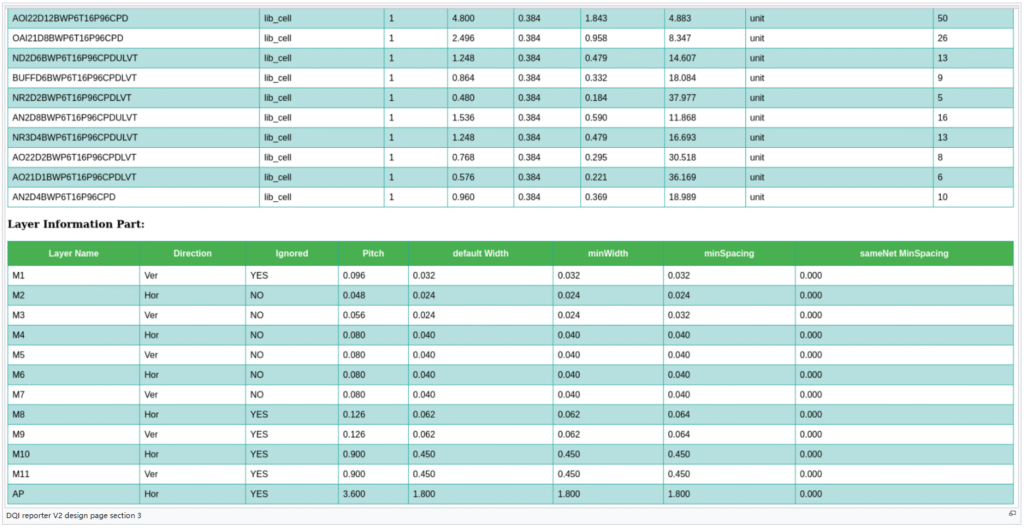
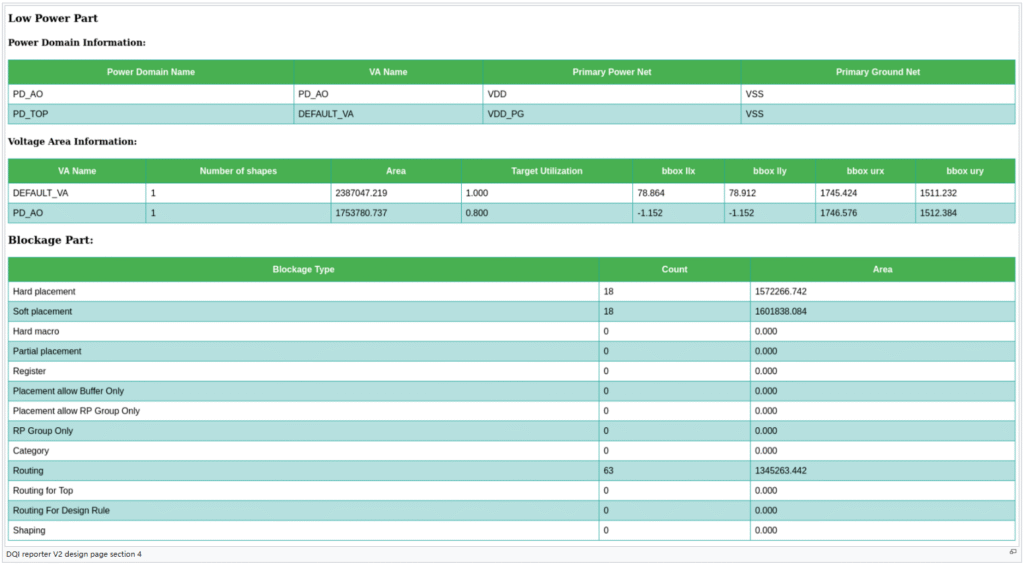
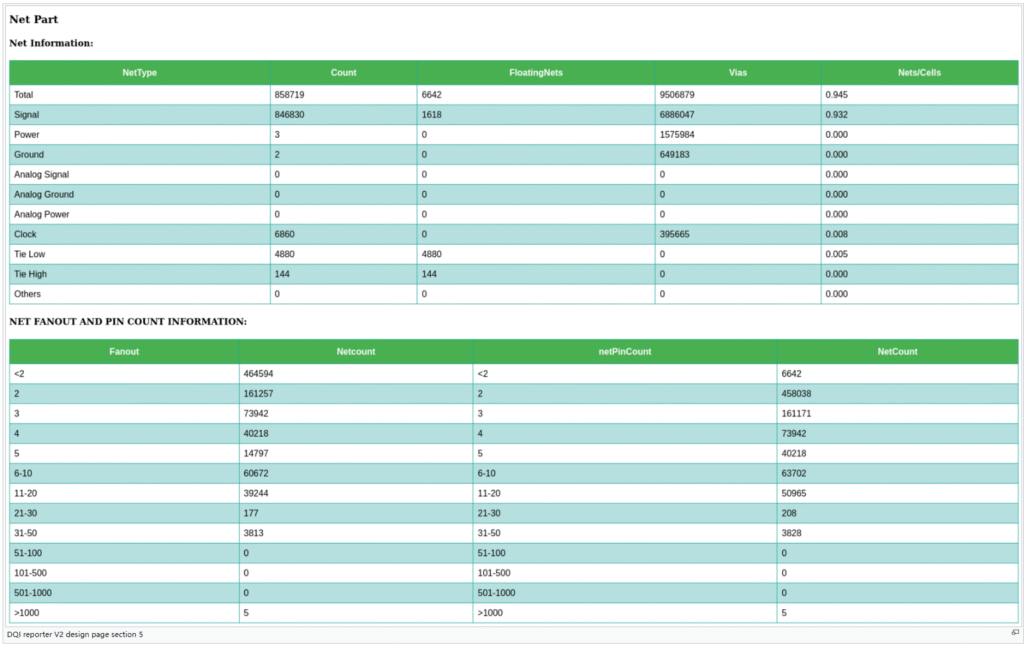
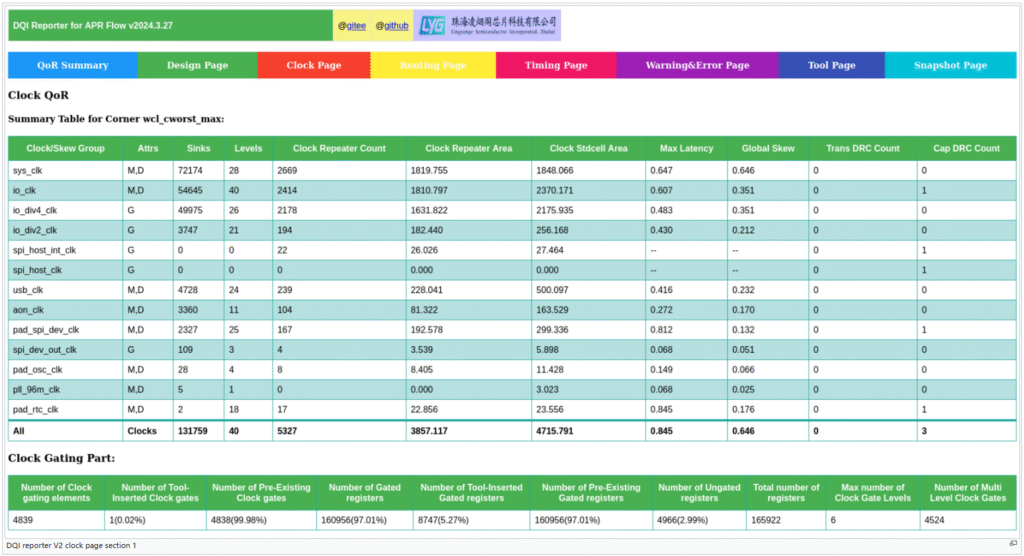
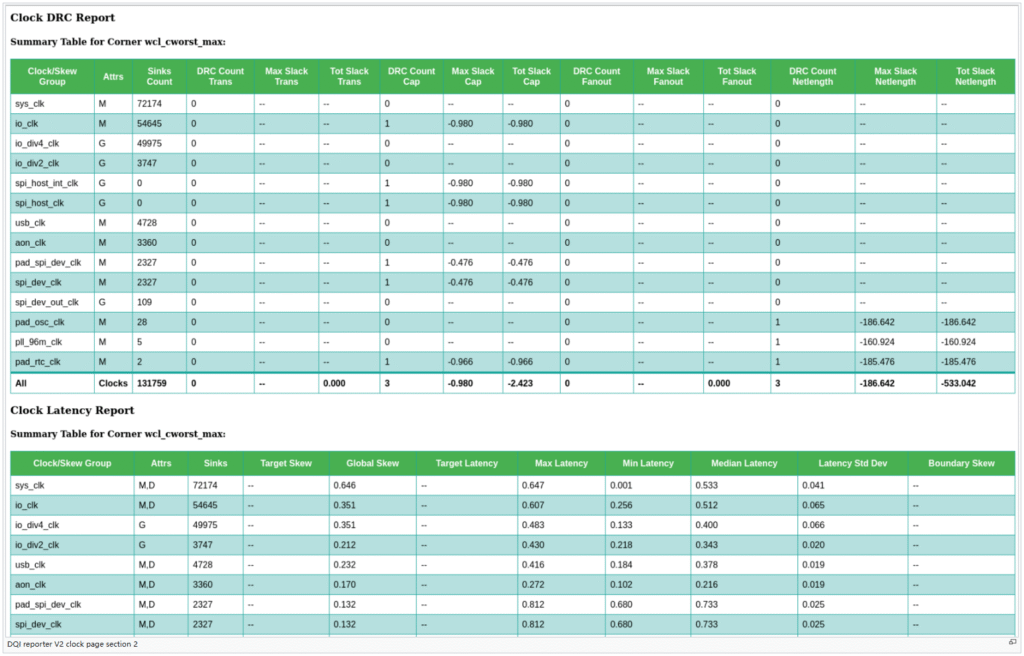
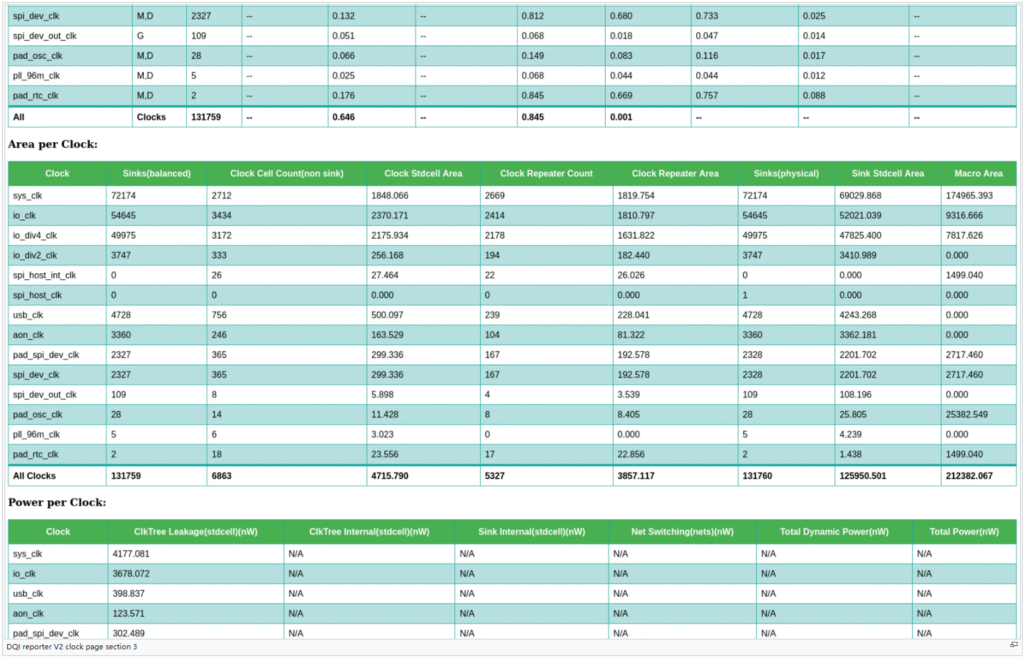
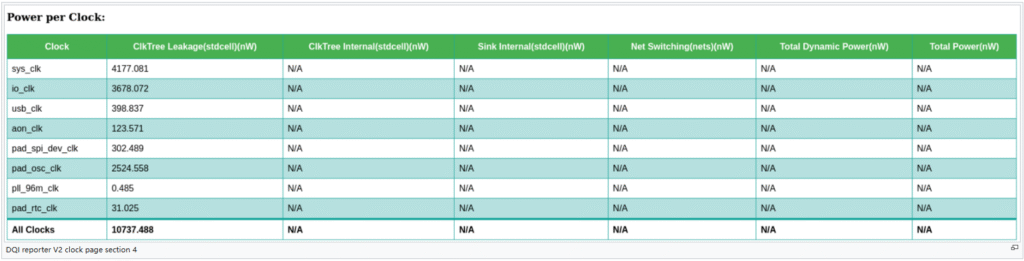
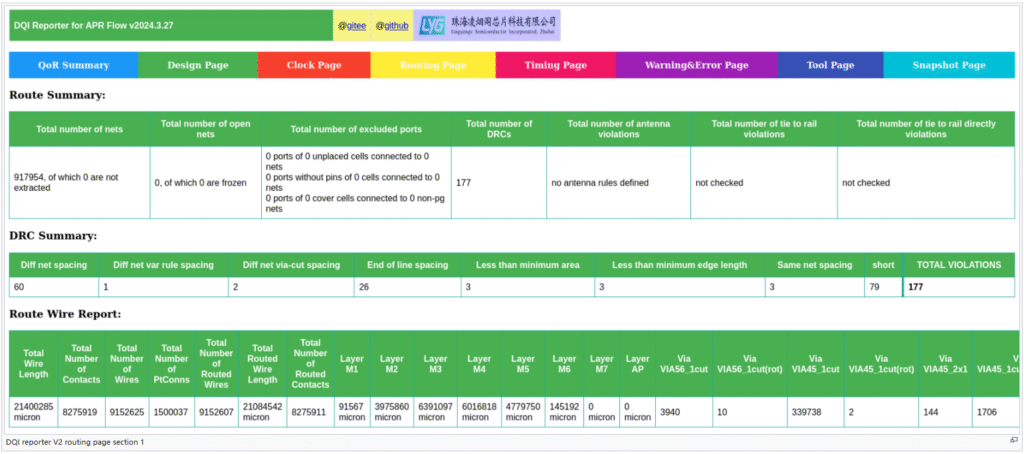
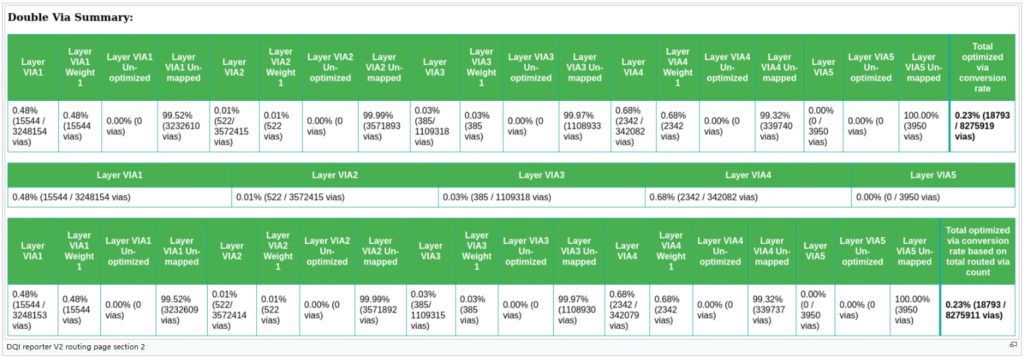
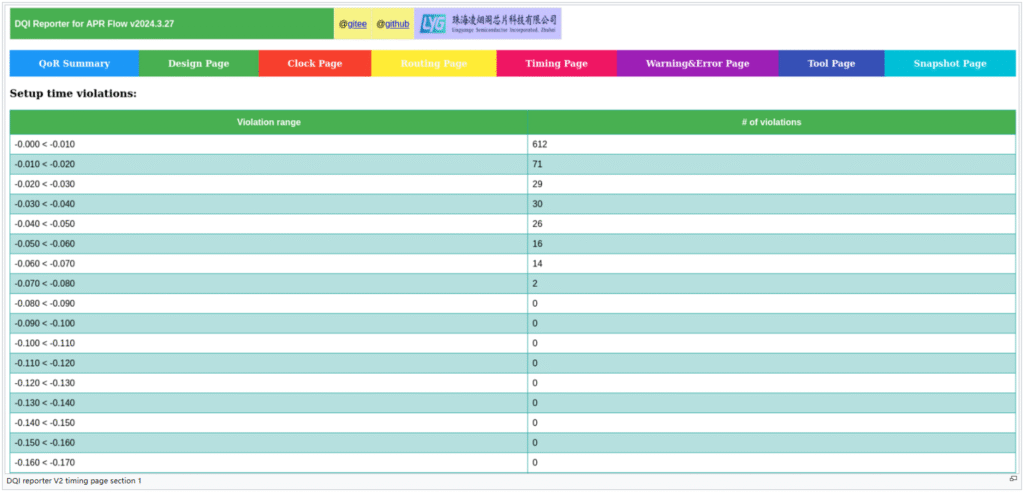
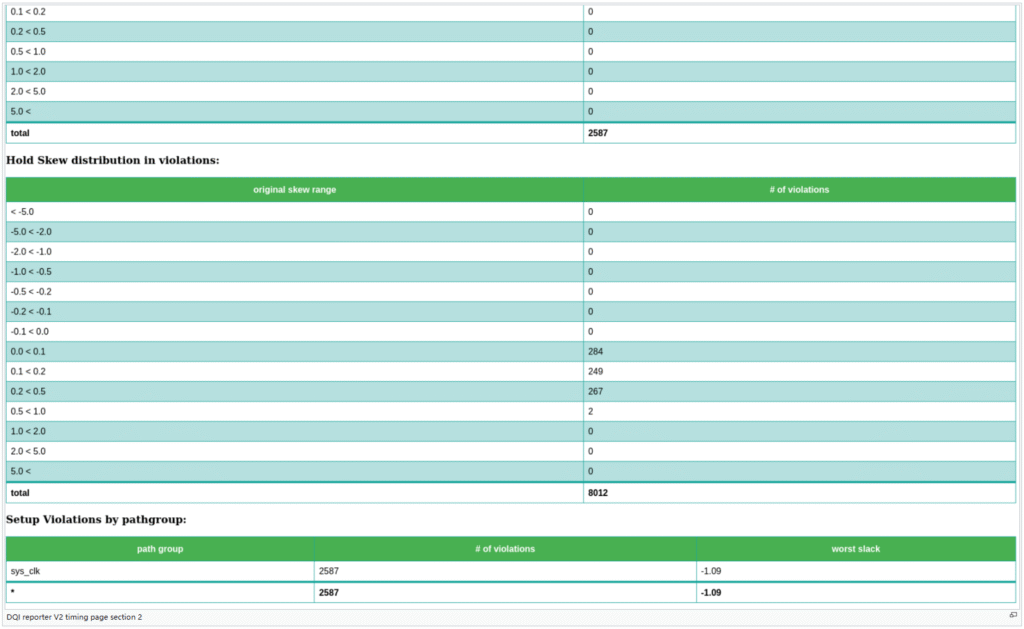
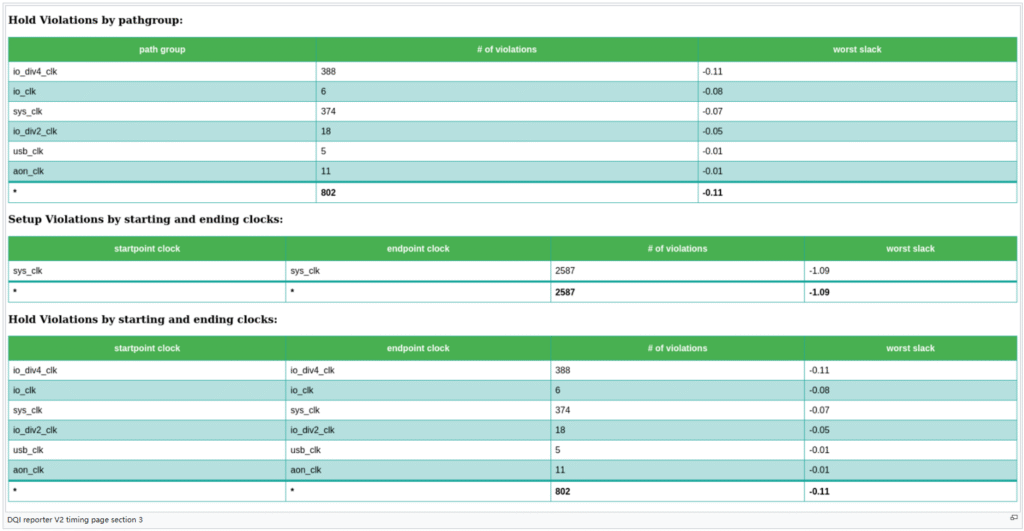
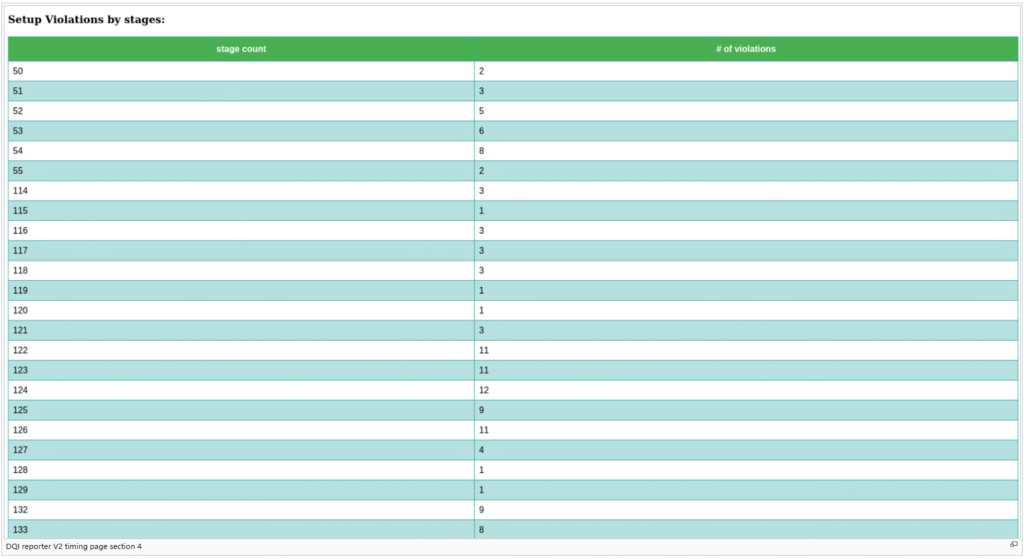
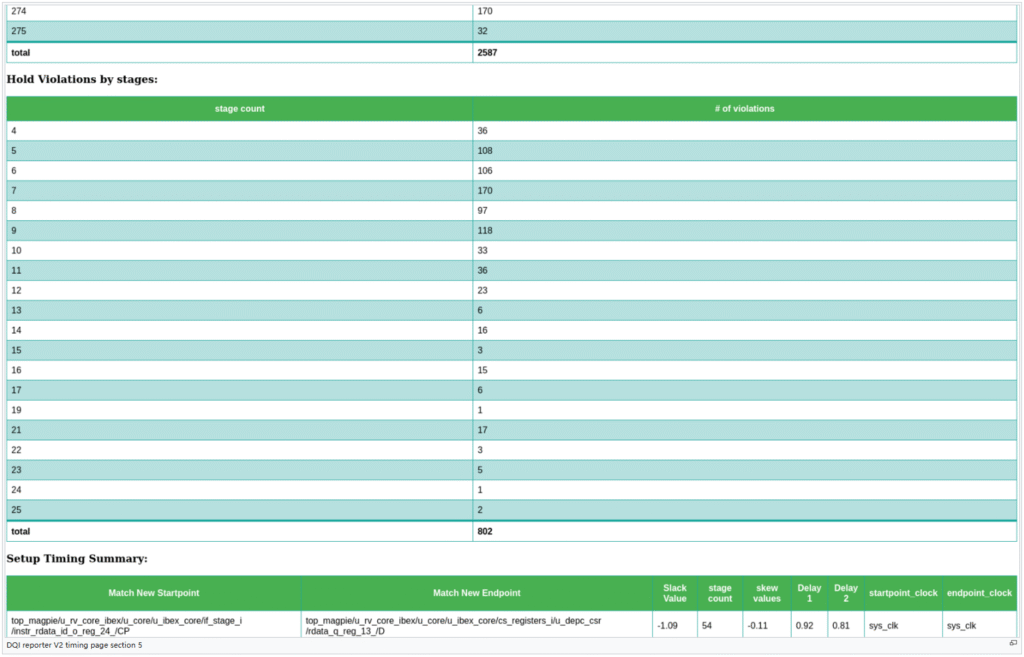
Version 2:
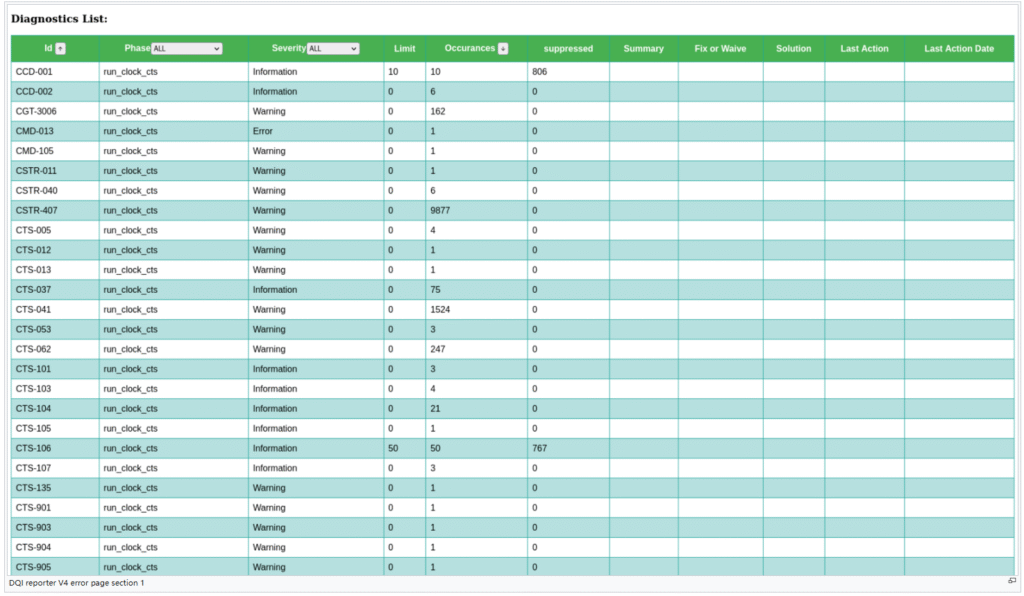
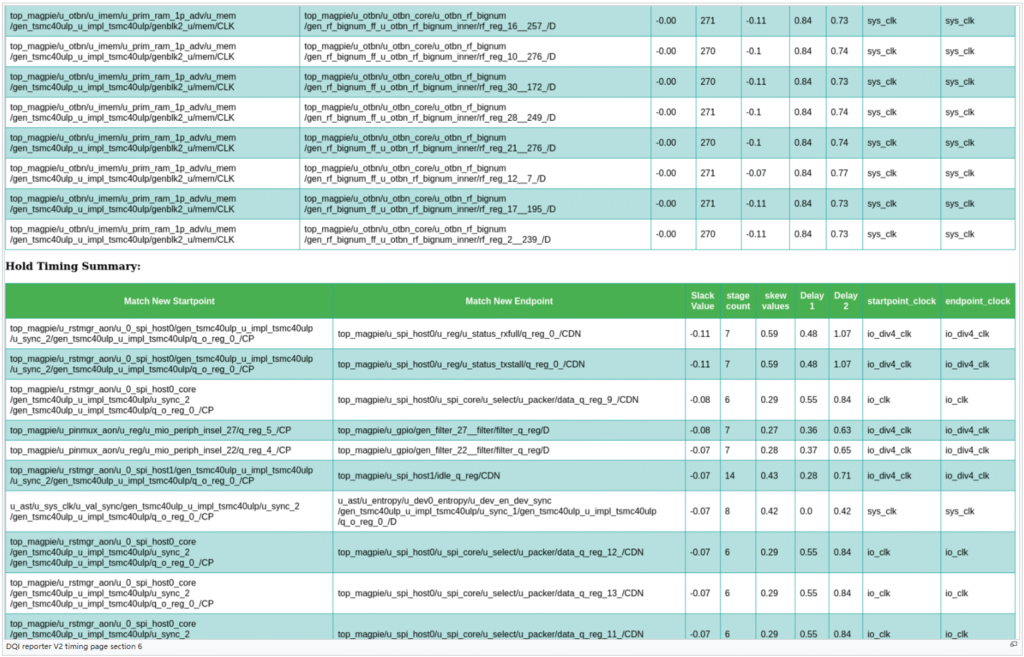
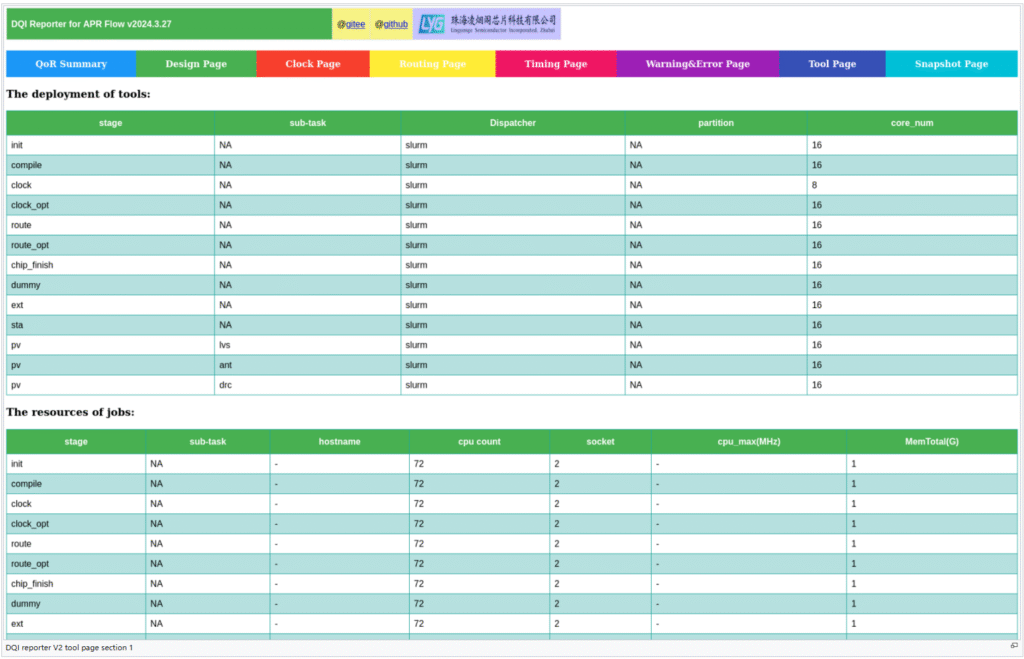
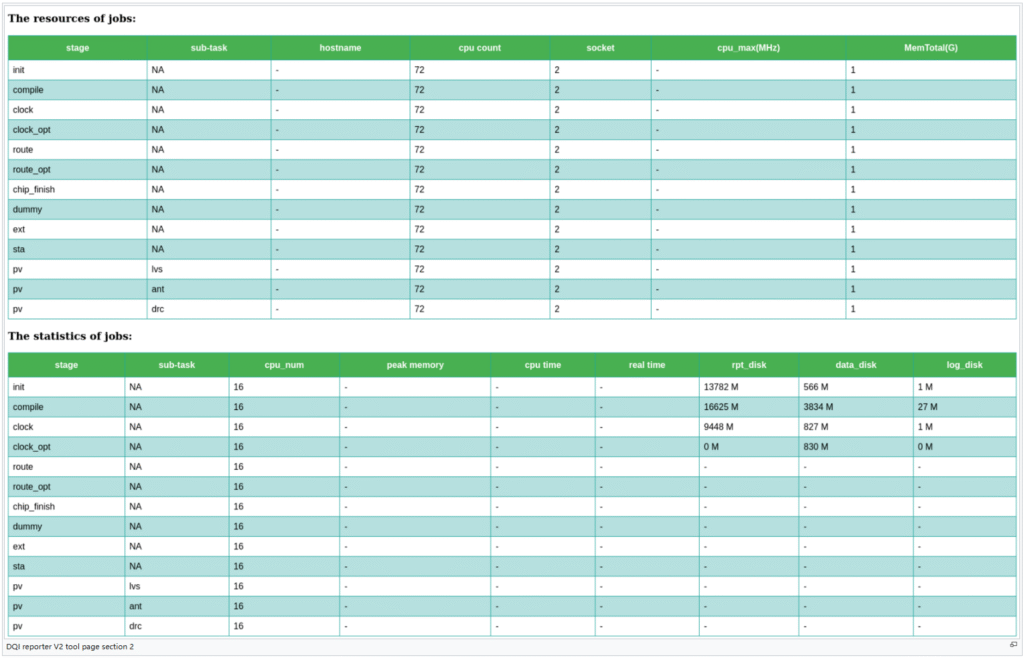
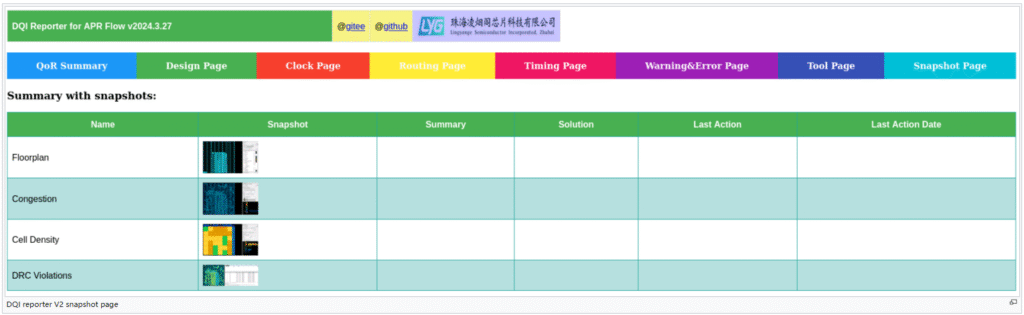
This is more elaborated version of DQI reporter. The html spanned into multiple pages with title bar for page switching. Among various page titles, summary and error pages are for multiple APR phases. The rest of page titles are all for single phase. The following snapshots show the details of html pages:
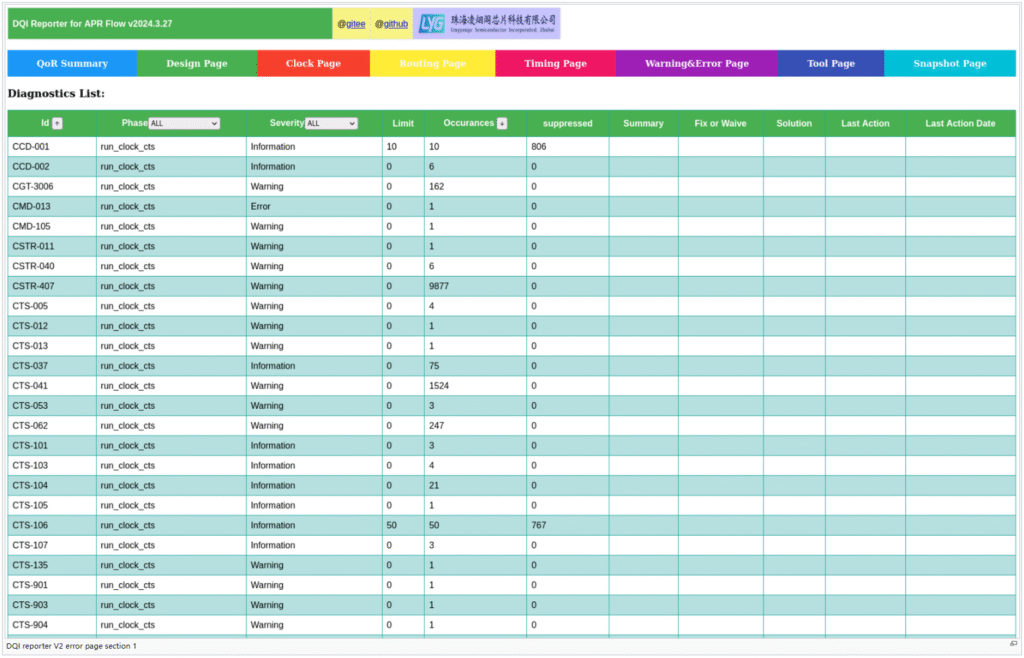
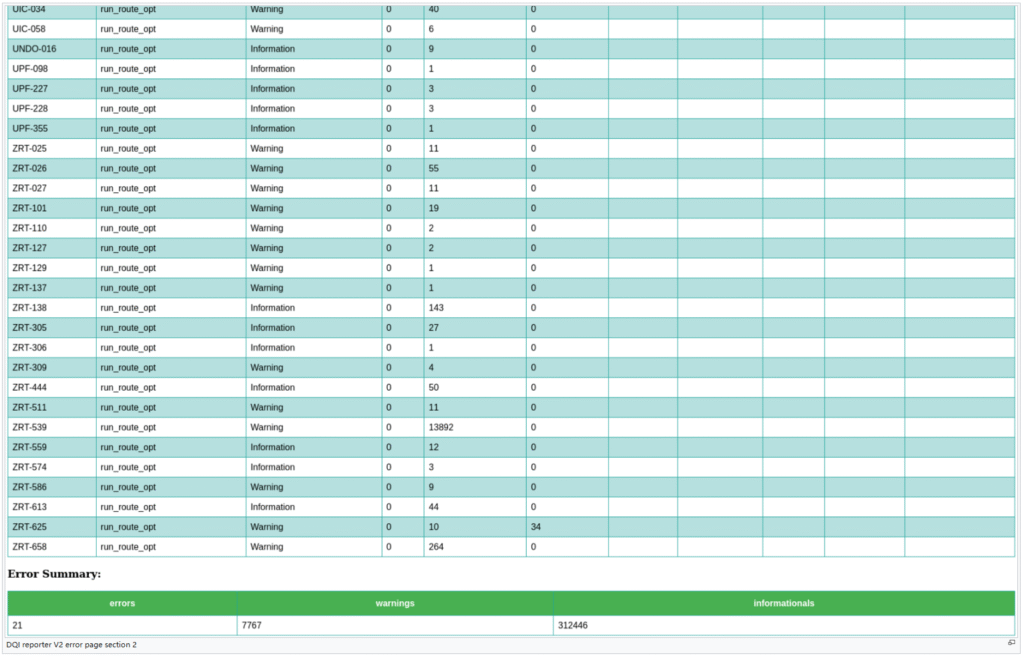
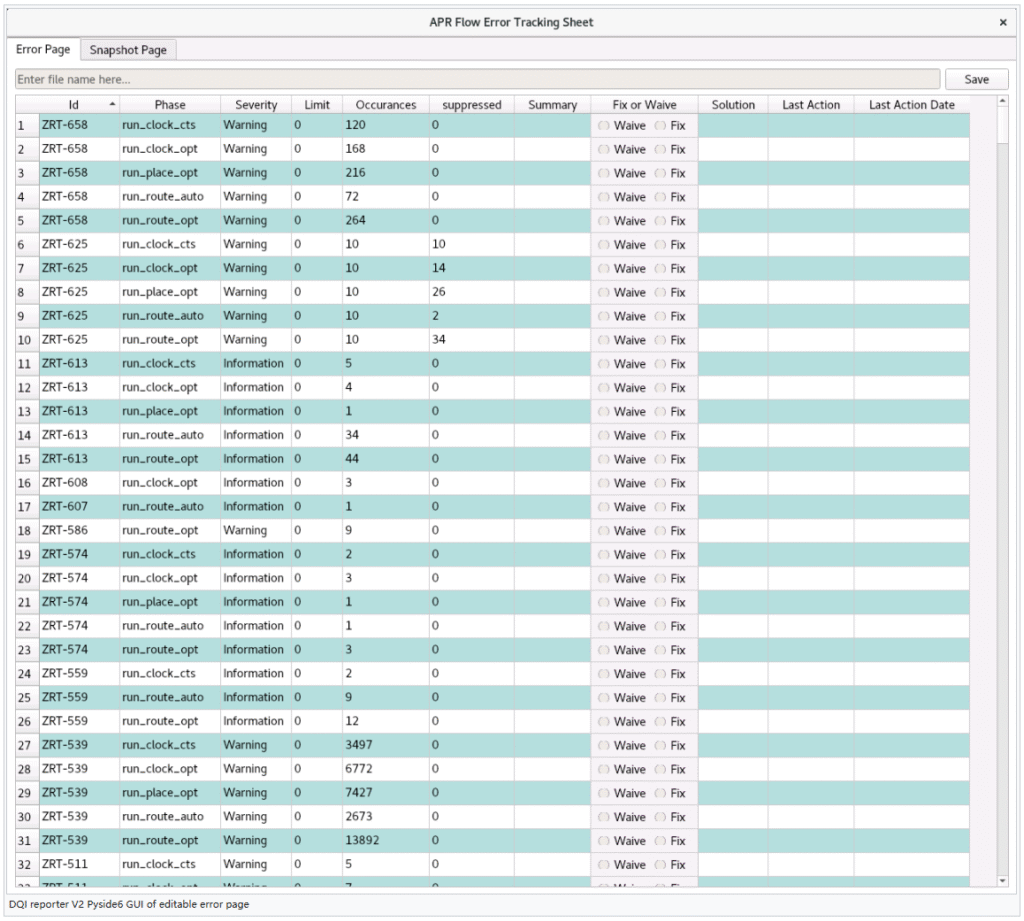
Error page has build-in sorting button and filters. The error and warning messages could be sorted or filtered according to designer’s will. However, html format means the error page could only be viewed but not for editing. For error pages with edit feature, we resort to Pyside 6 program. Here’s GUI of Pyside 6 program. This program enable us to do editing on the table. The result of editing table could be saved and viewed by html browser. Here’s the snapshot of the tool:
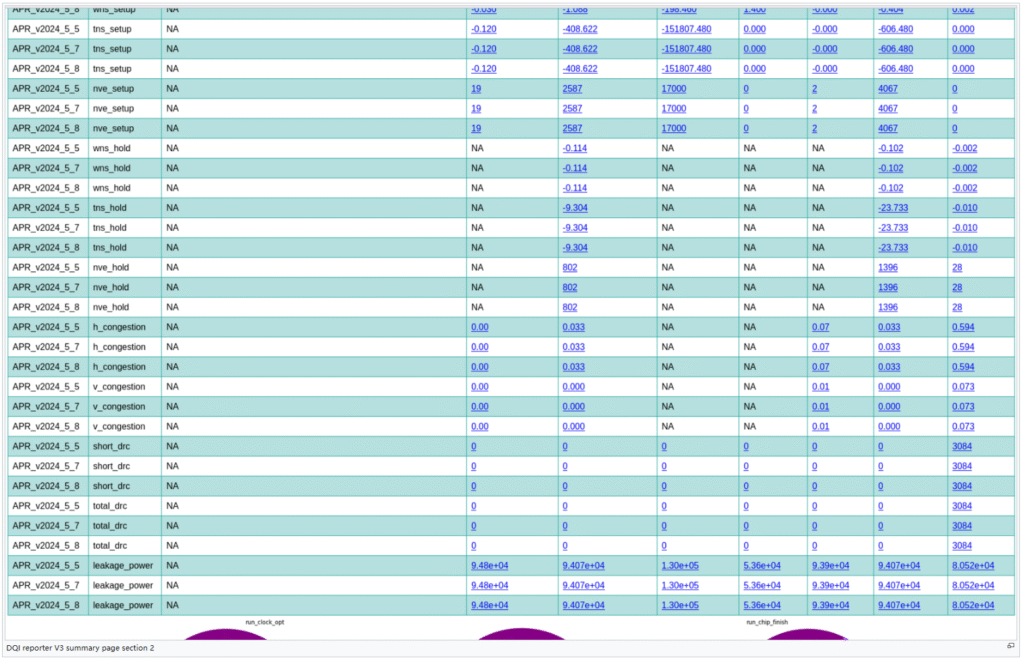
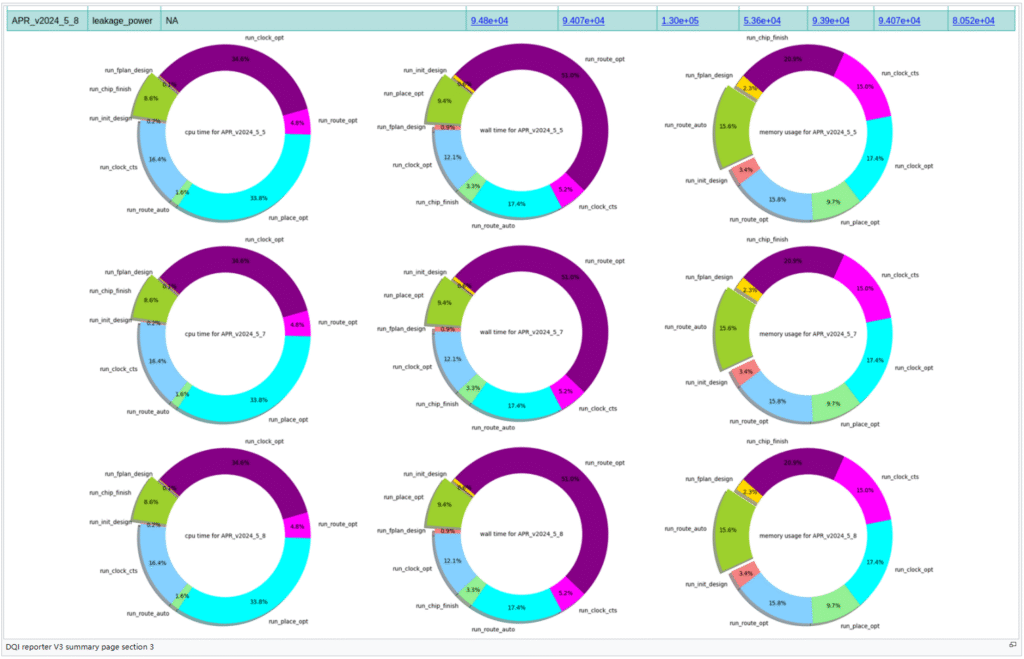
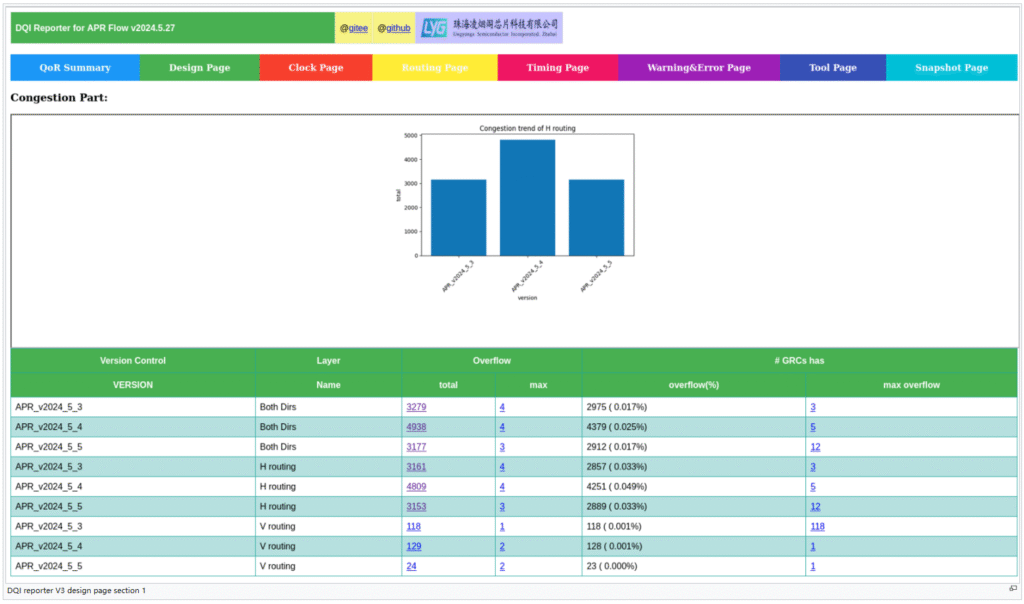
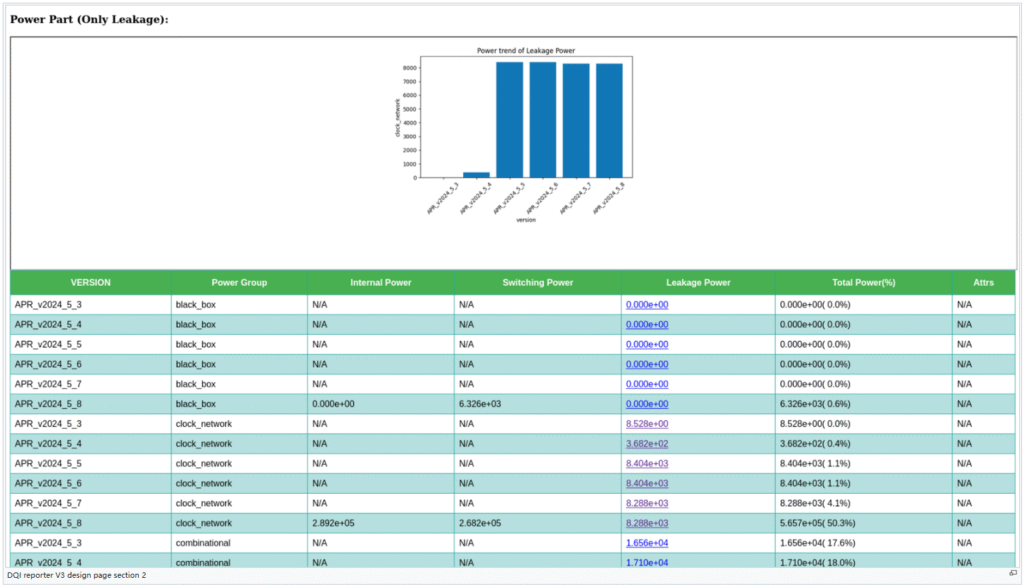
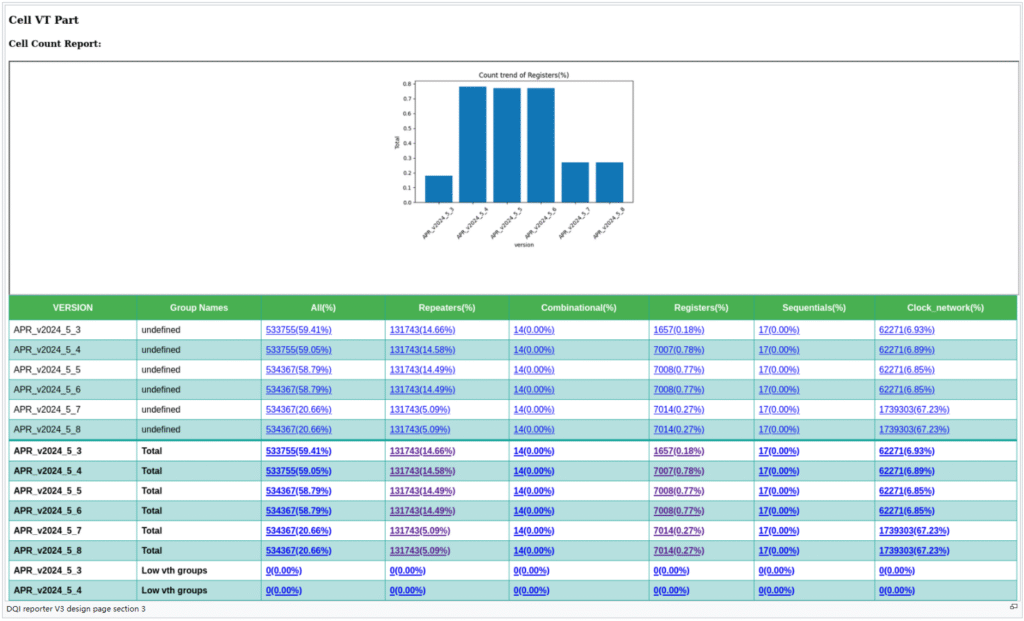
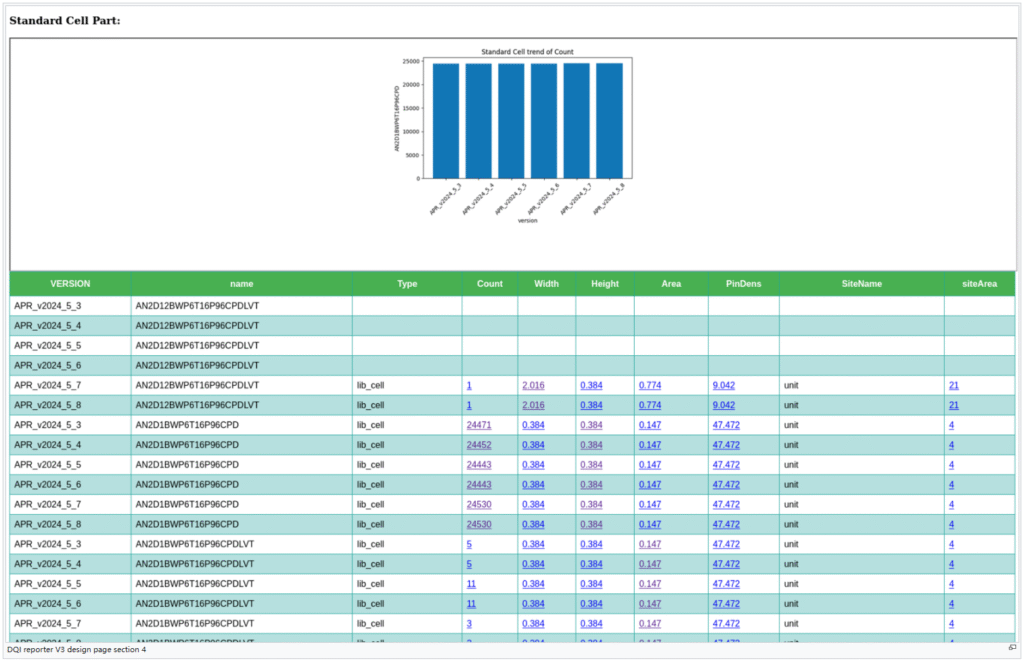
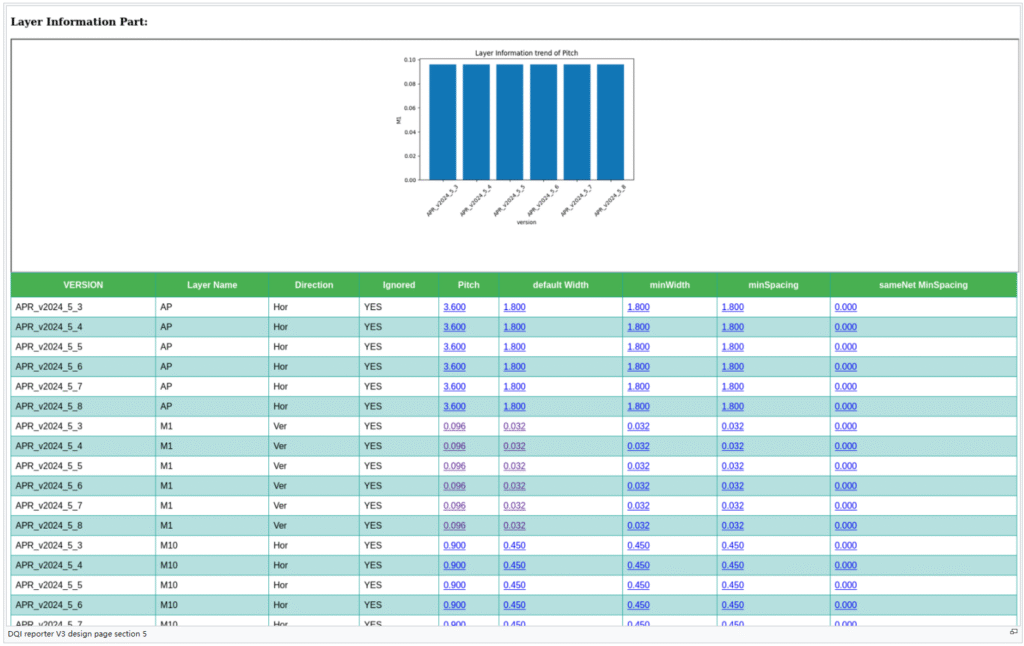
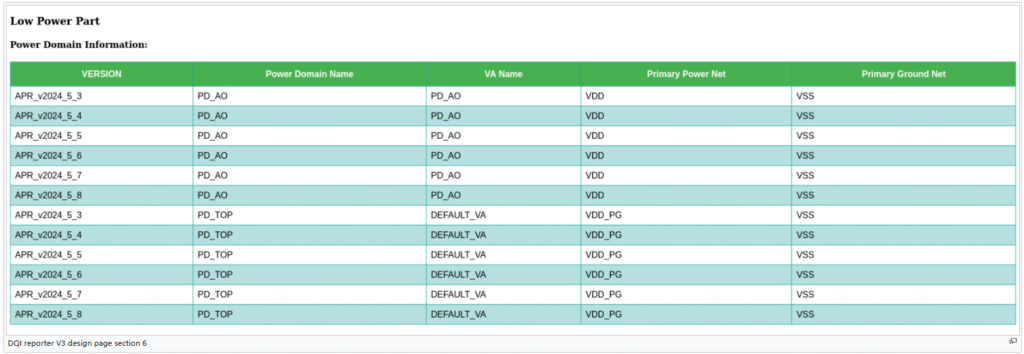
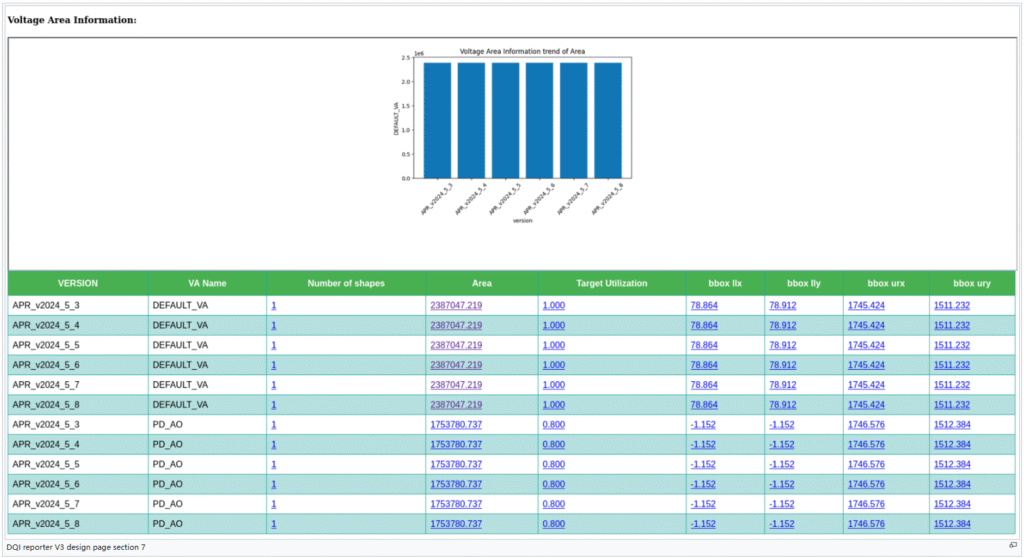
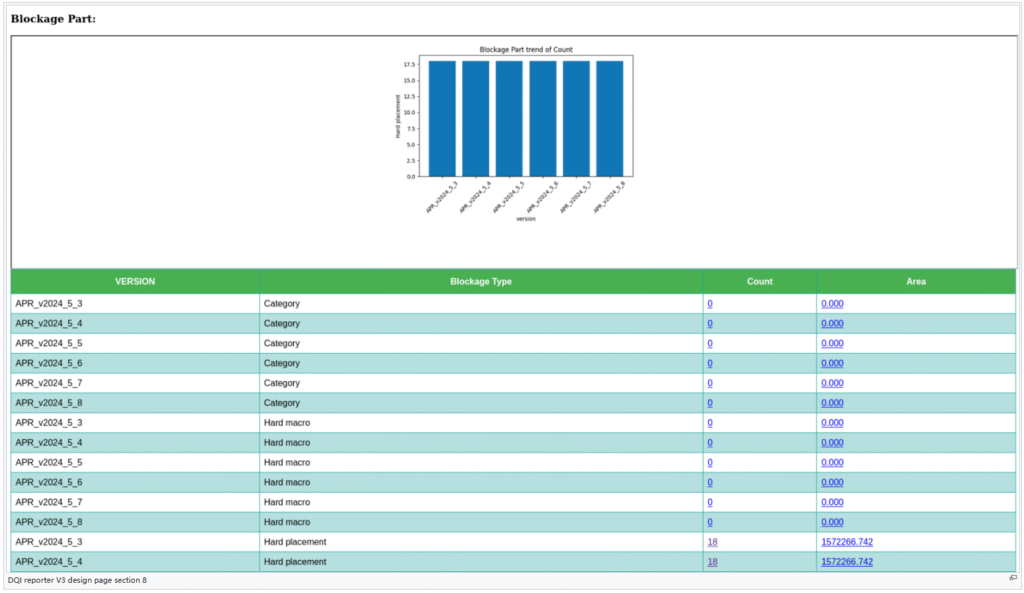
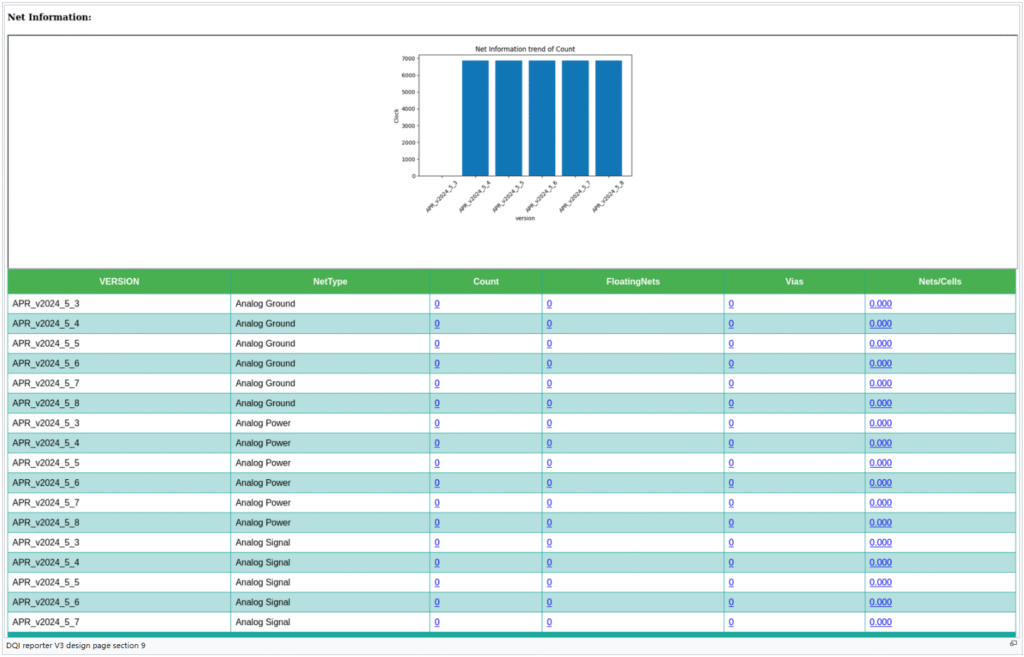
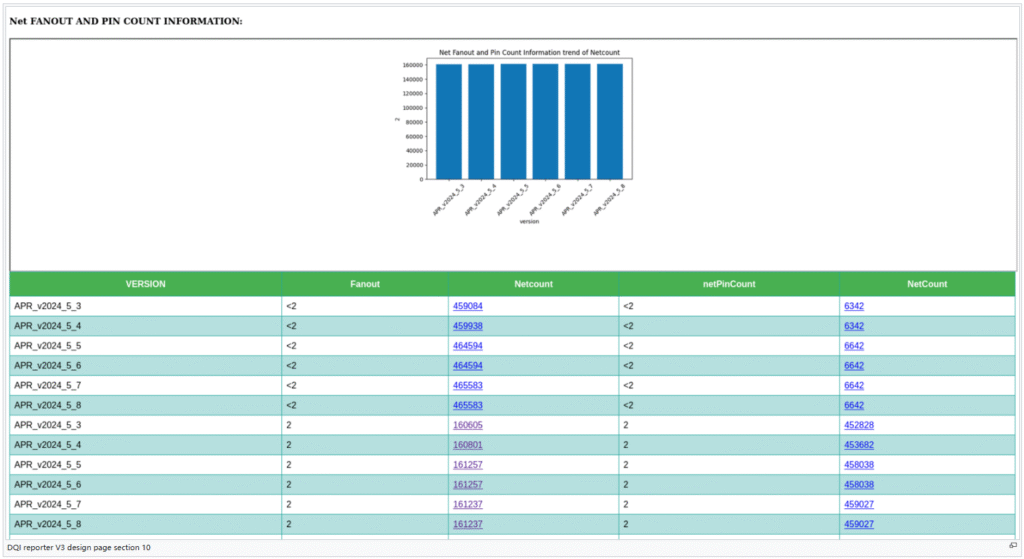
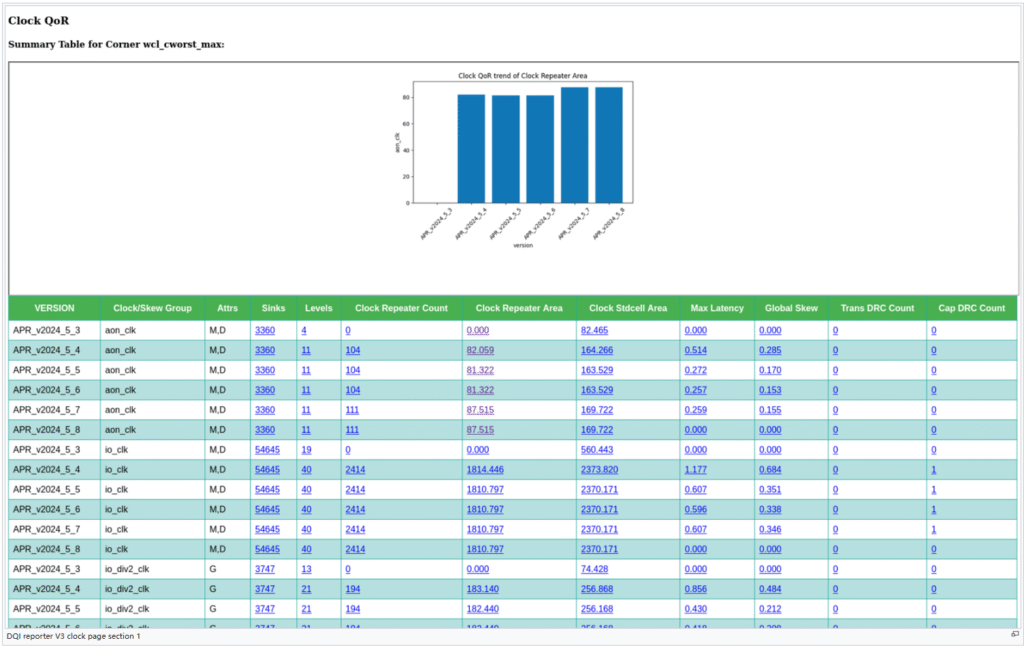
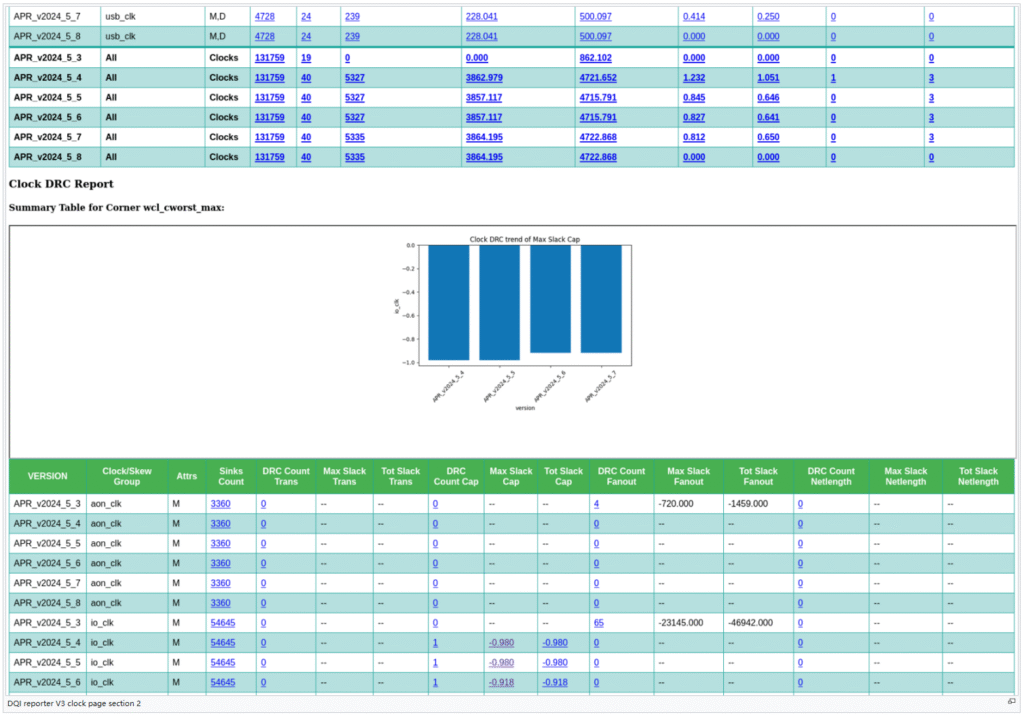
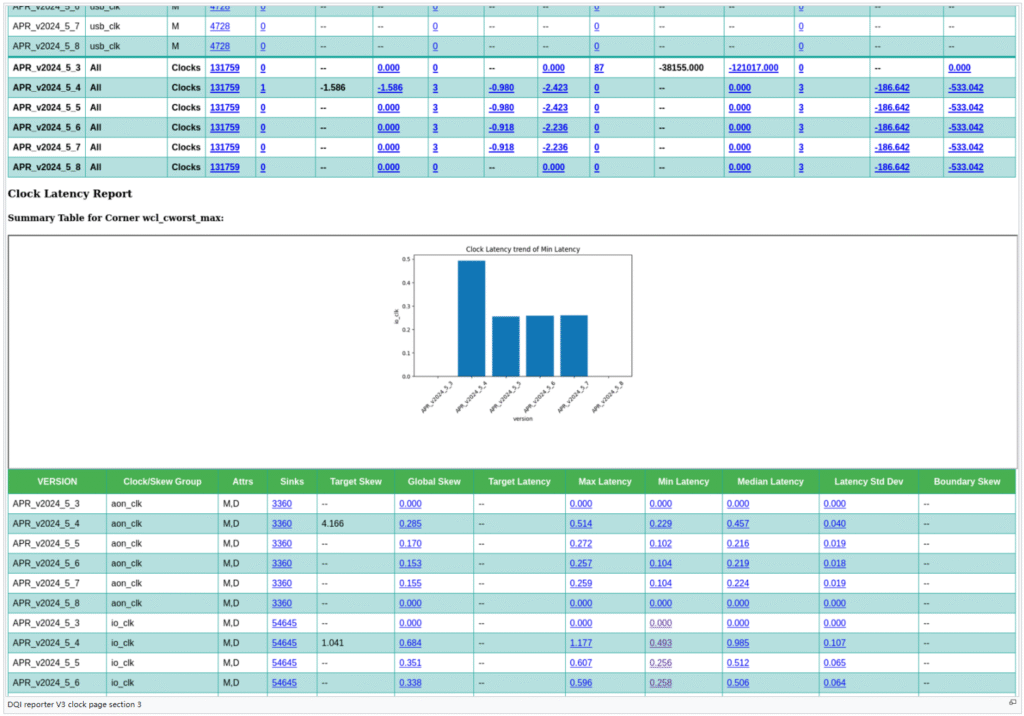
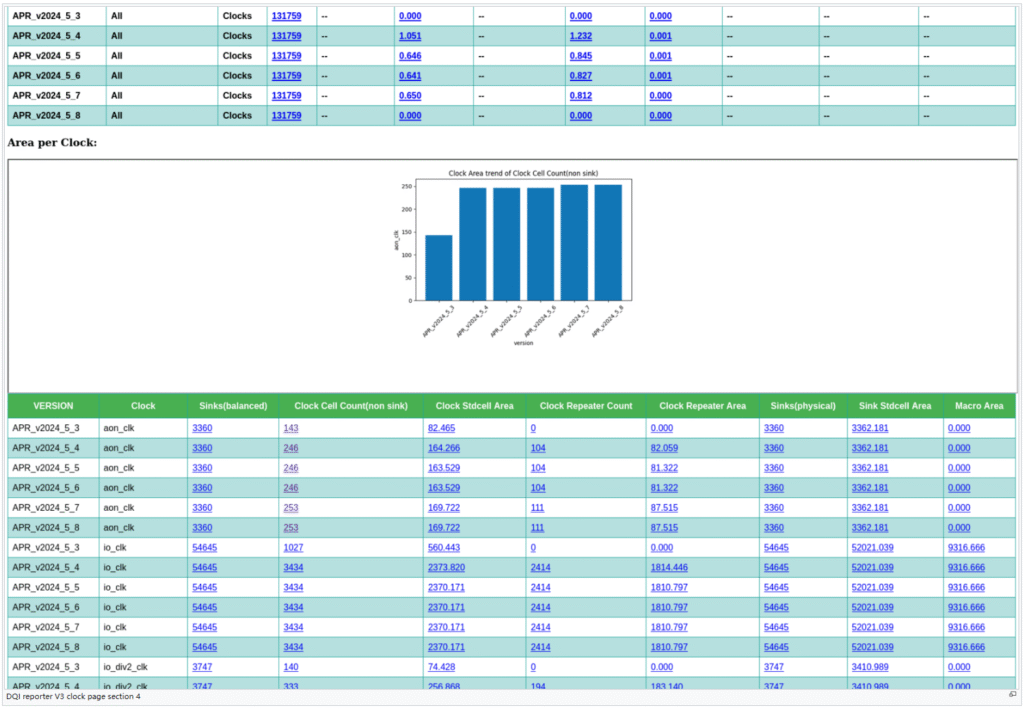
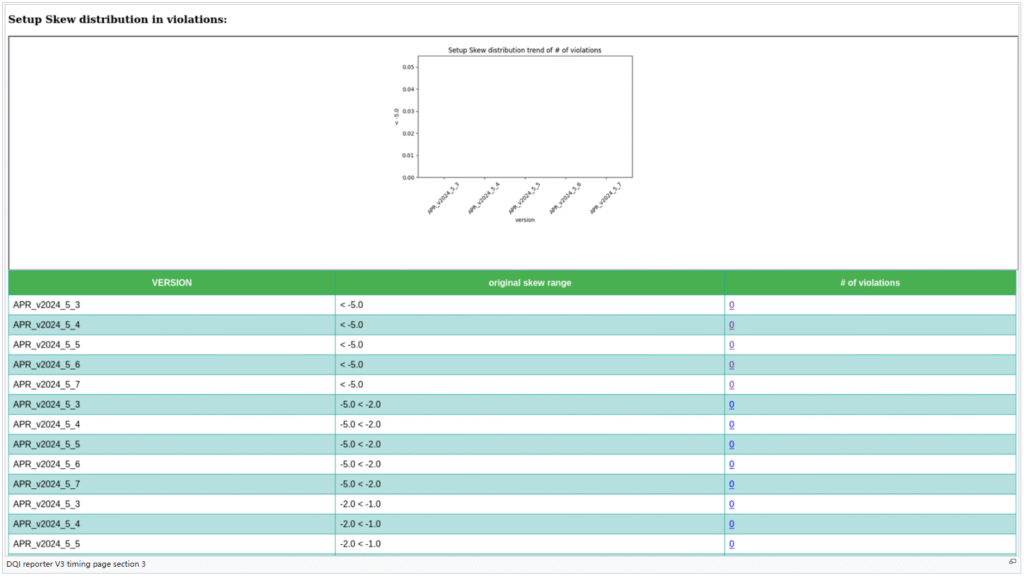
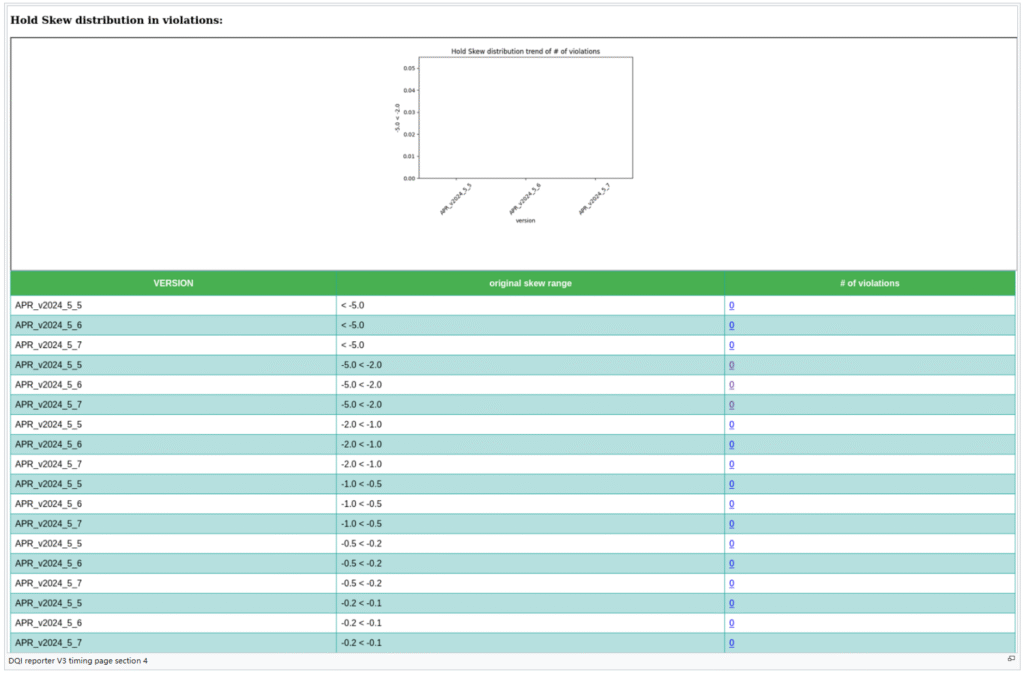
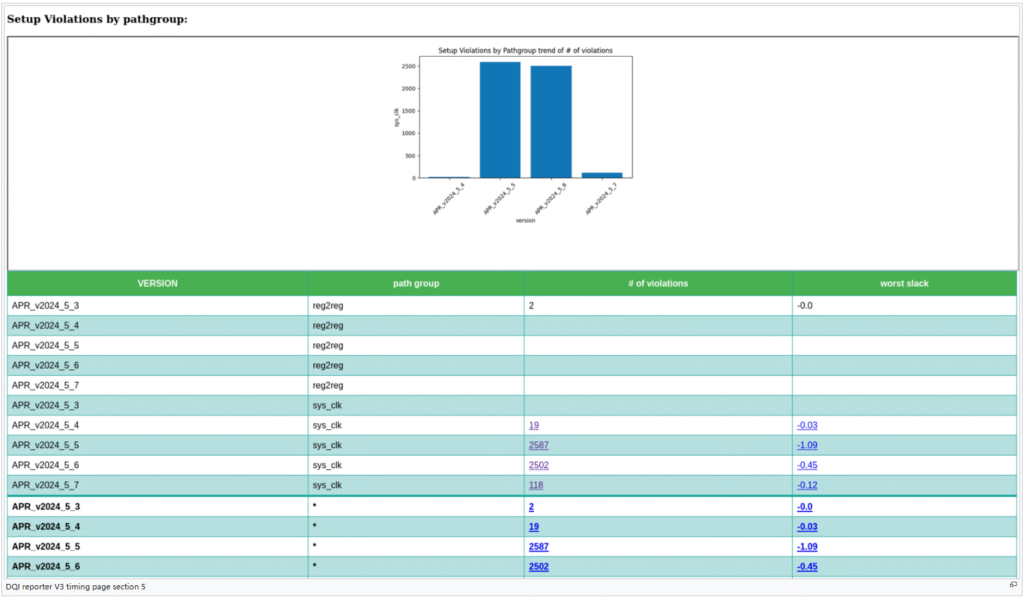
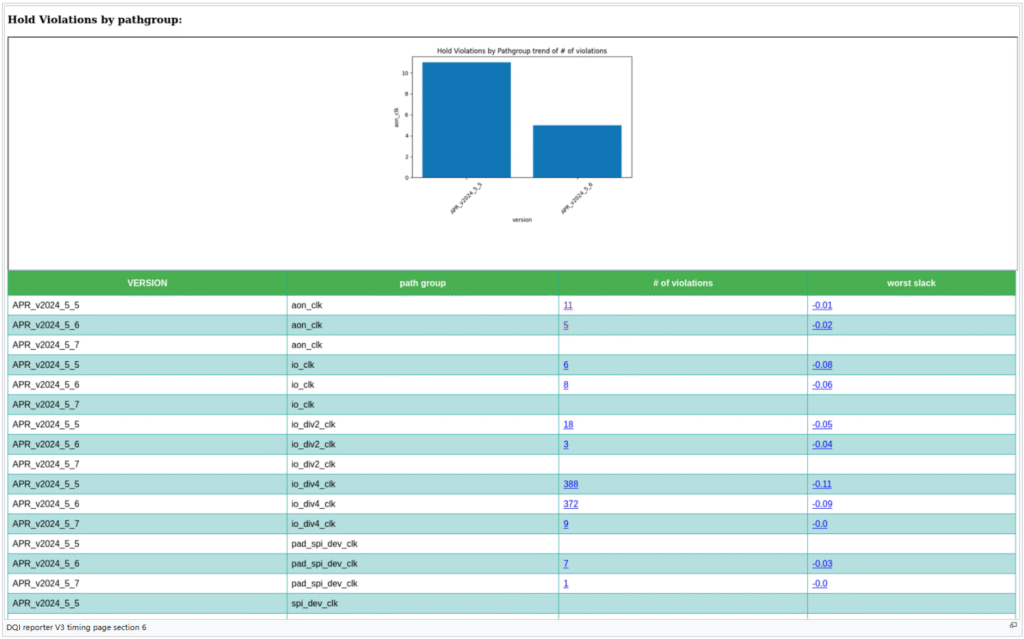
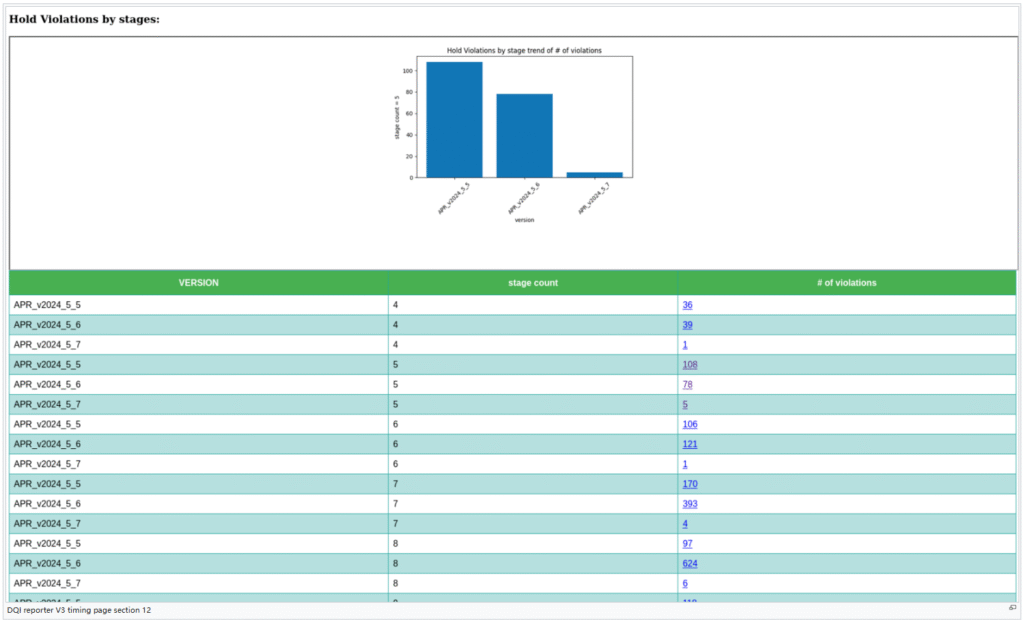
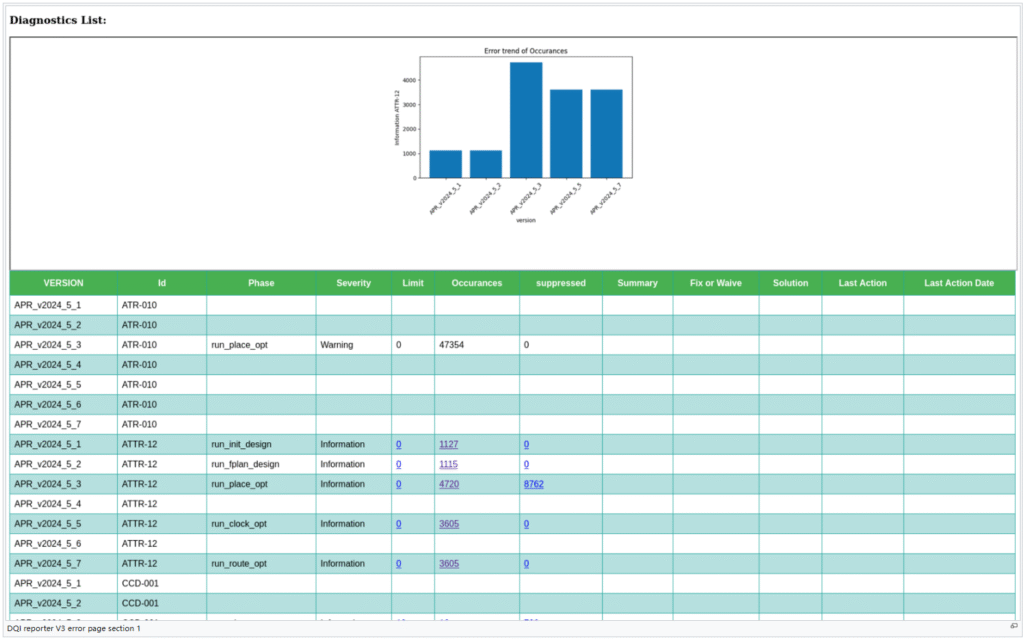
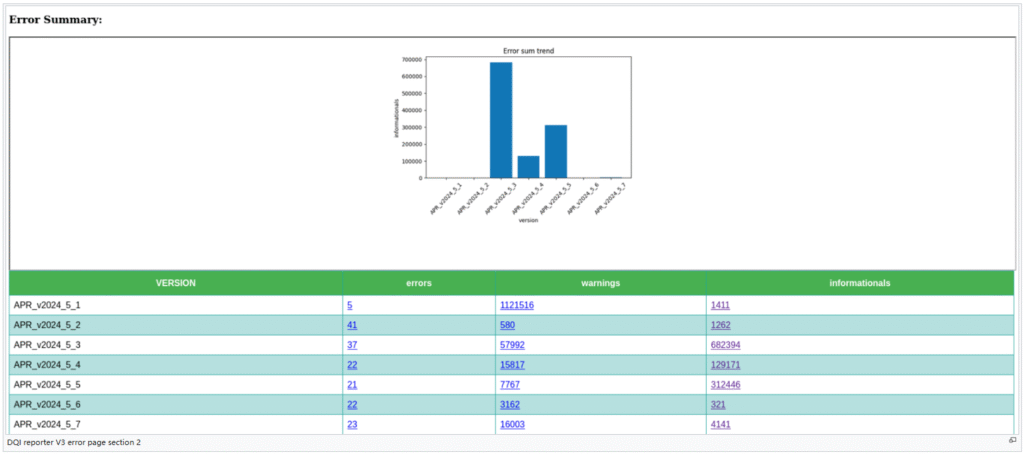
Version 3:
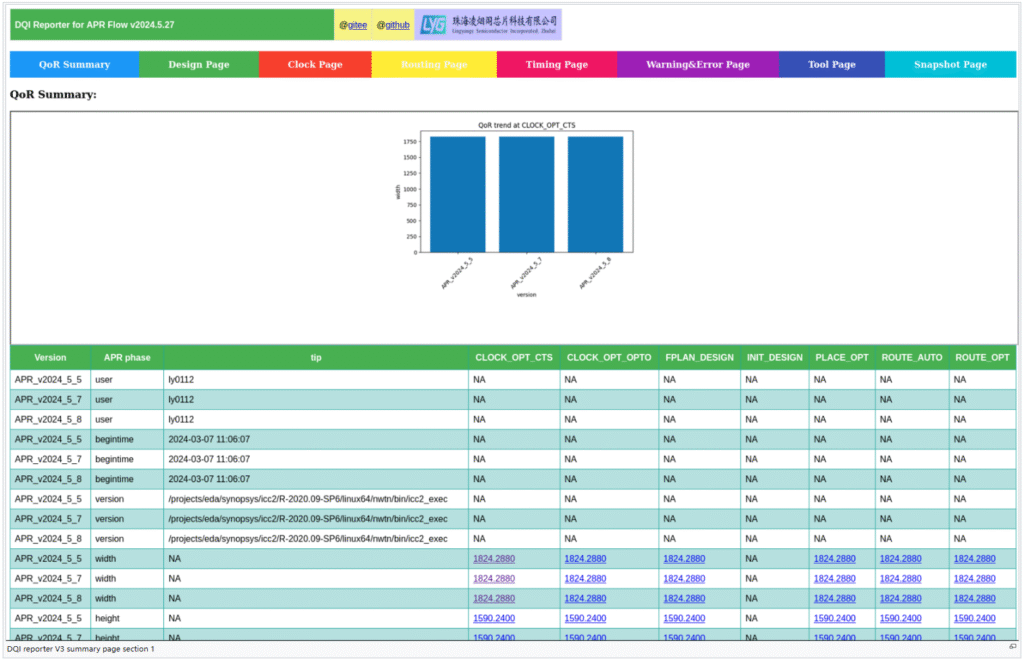
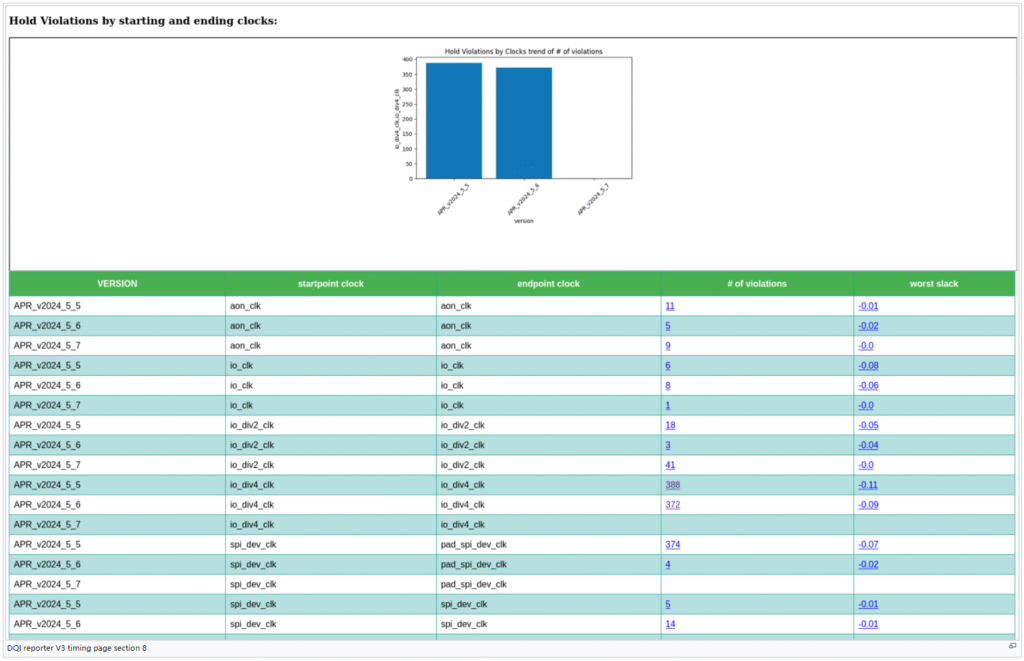
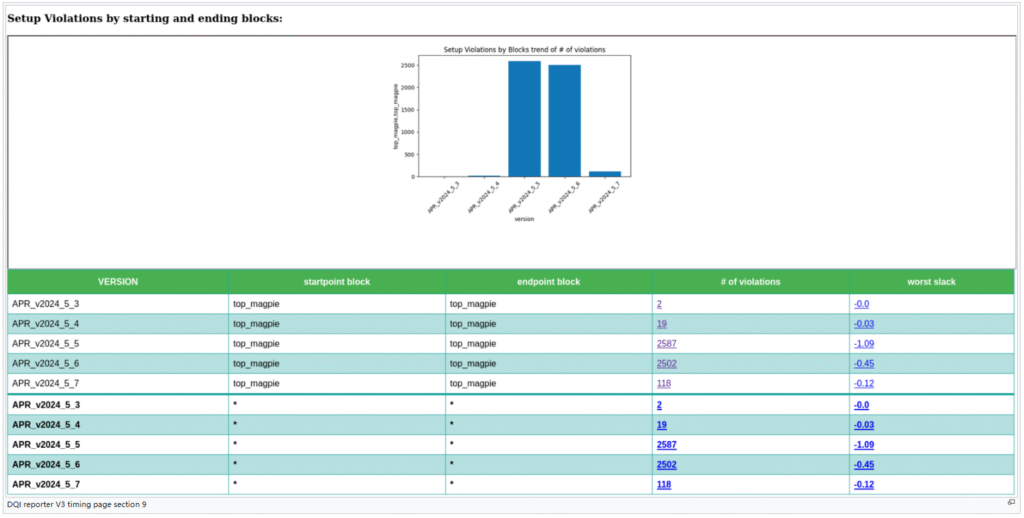
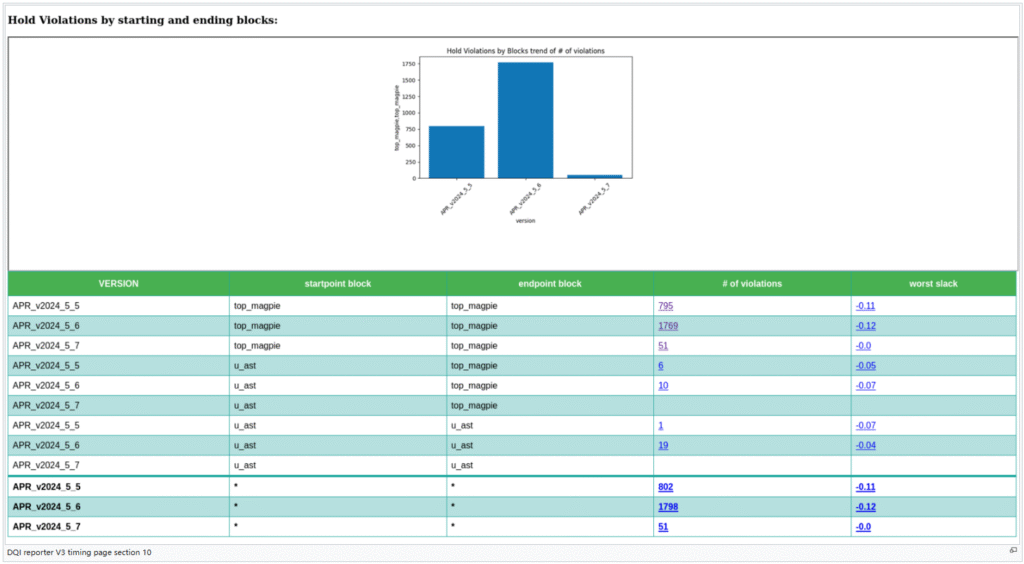
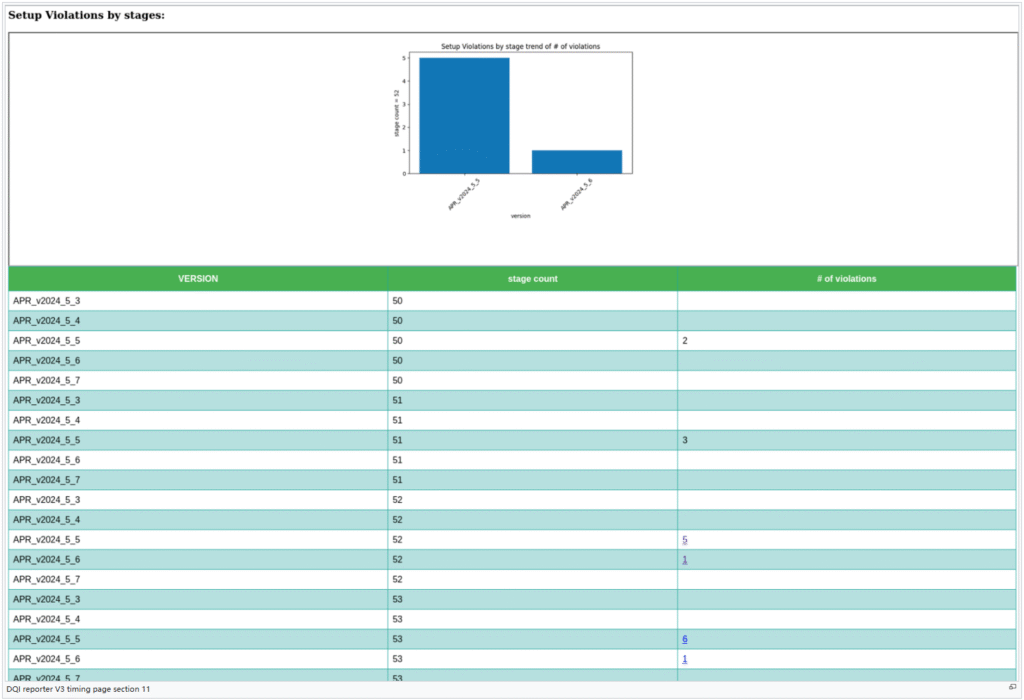
In design life, for many times we may need compare data against different versions. Version 3 of DQI reporter offers this comparison feature. Here’s the snapshots of this version html report:
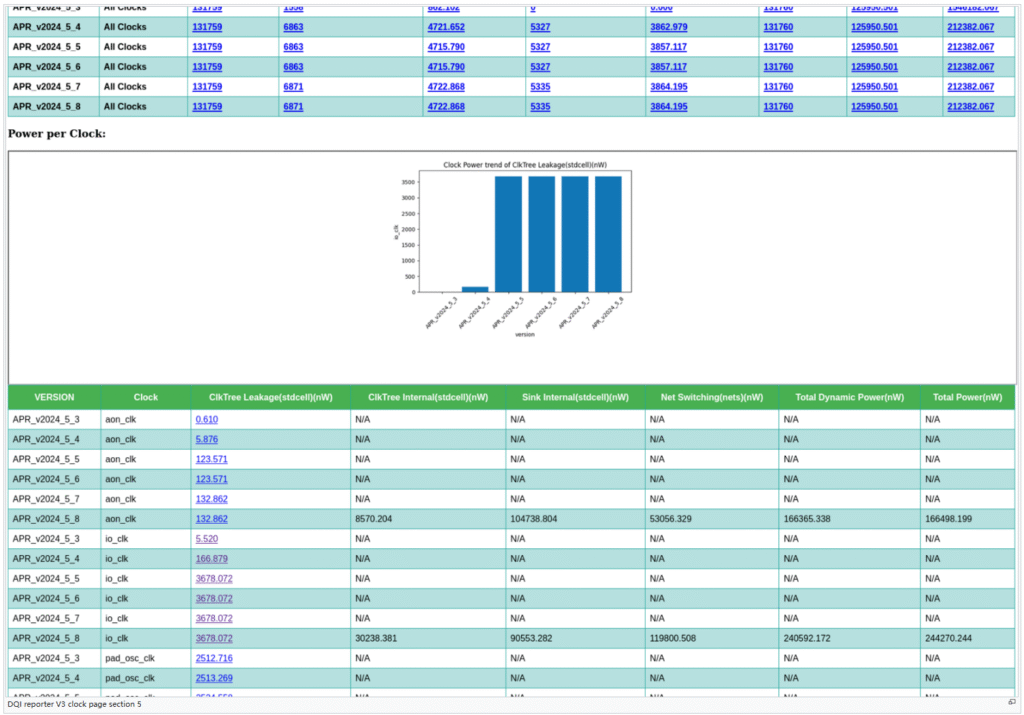
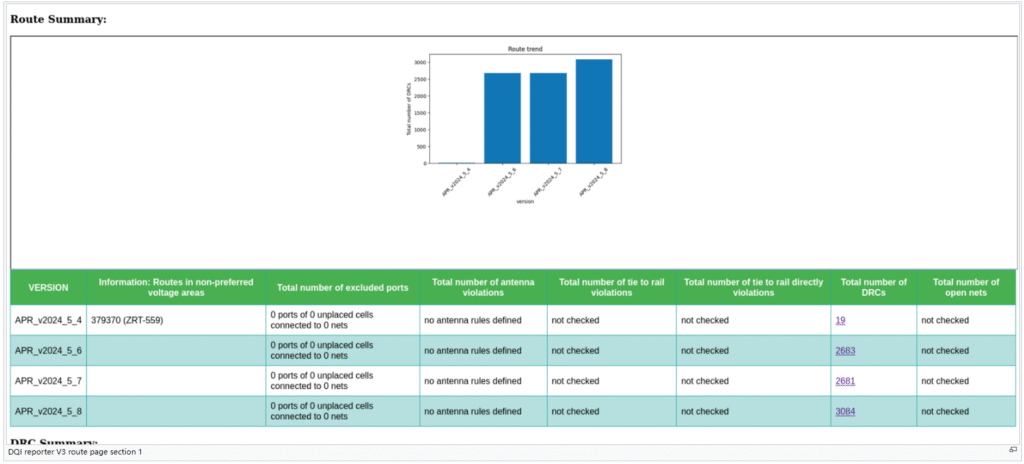
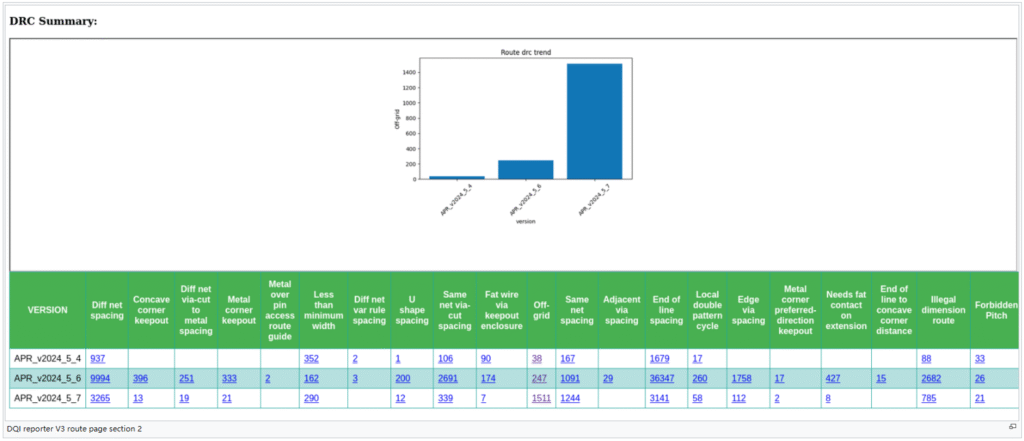
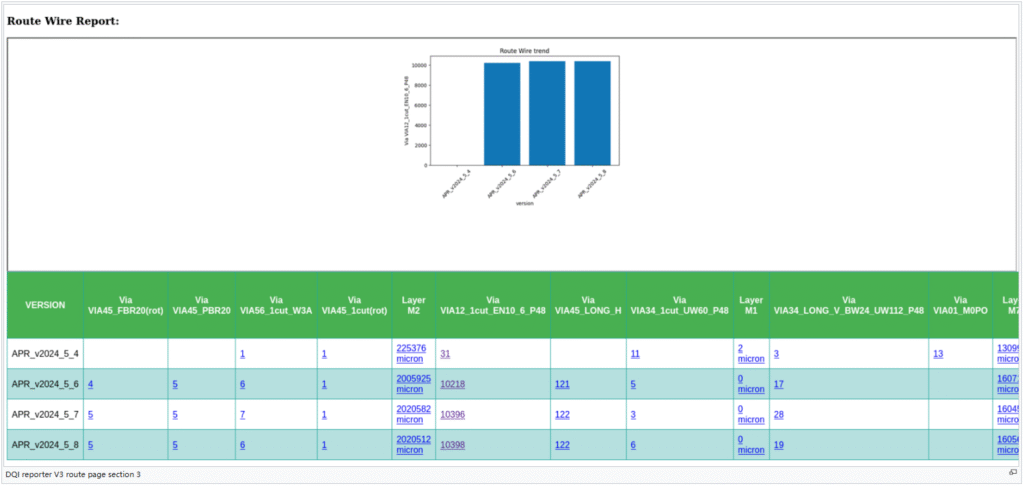
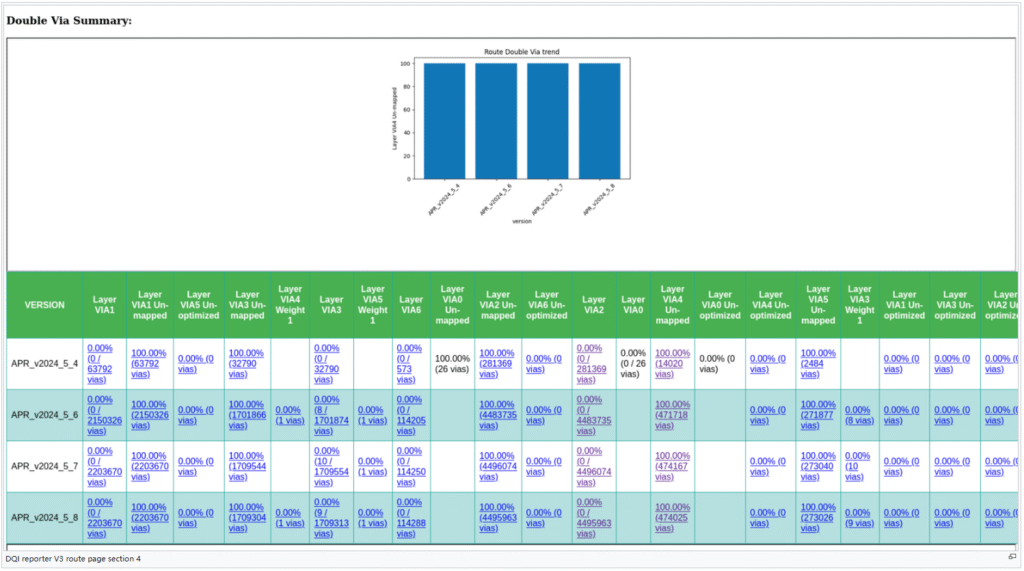
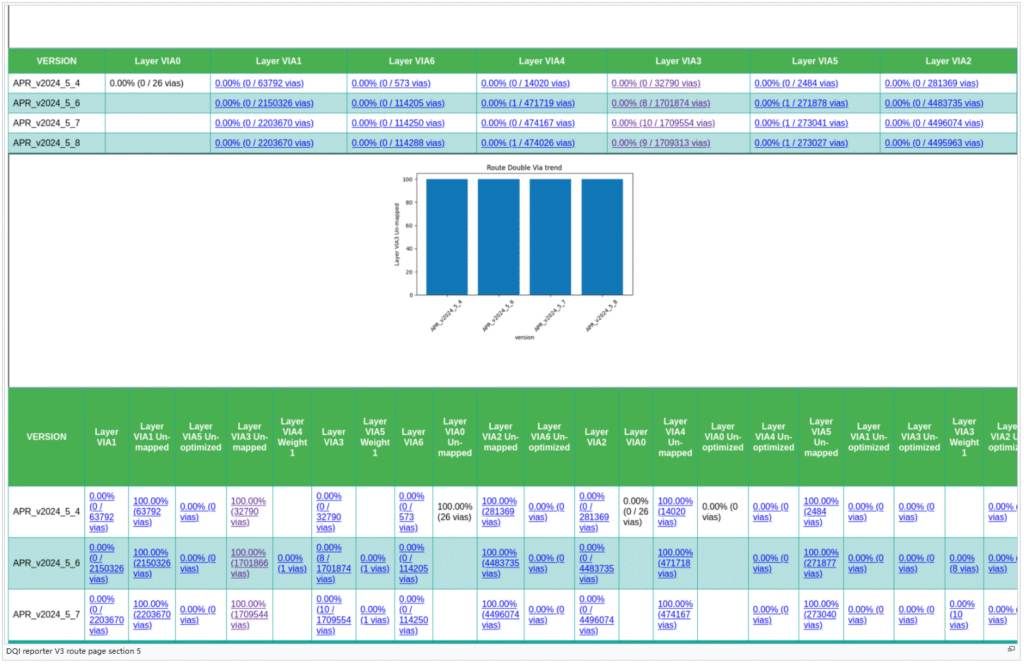
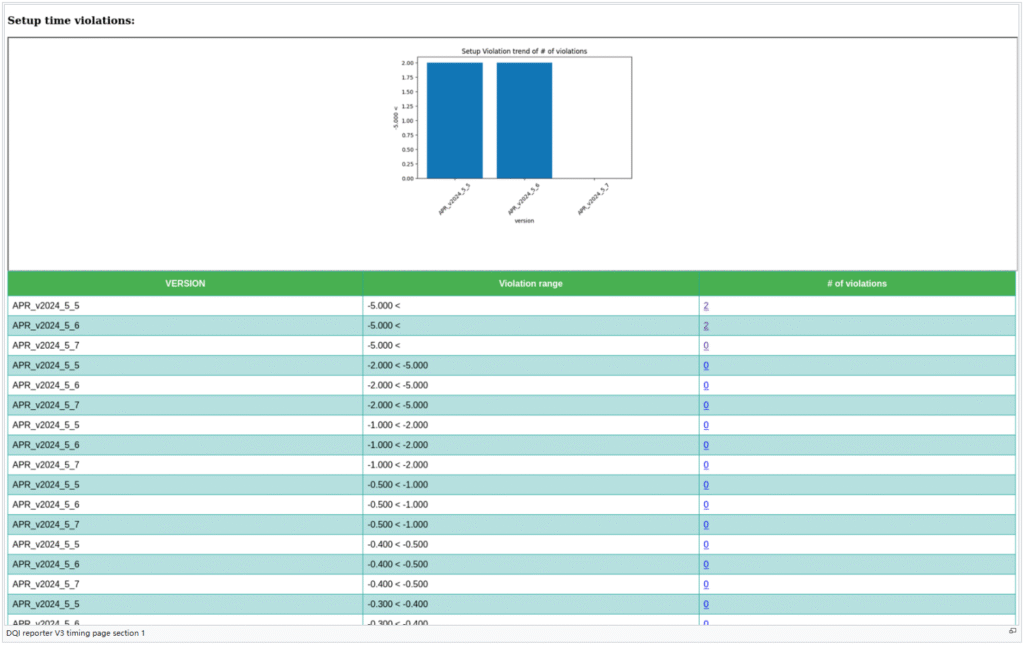
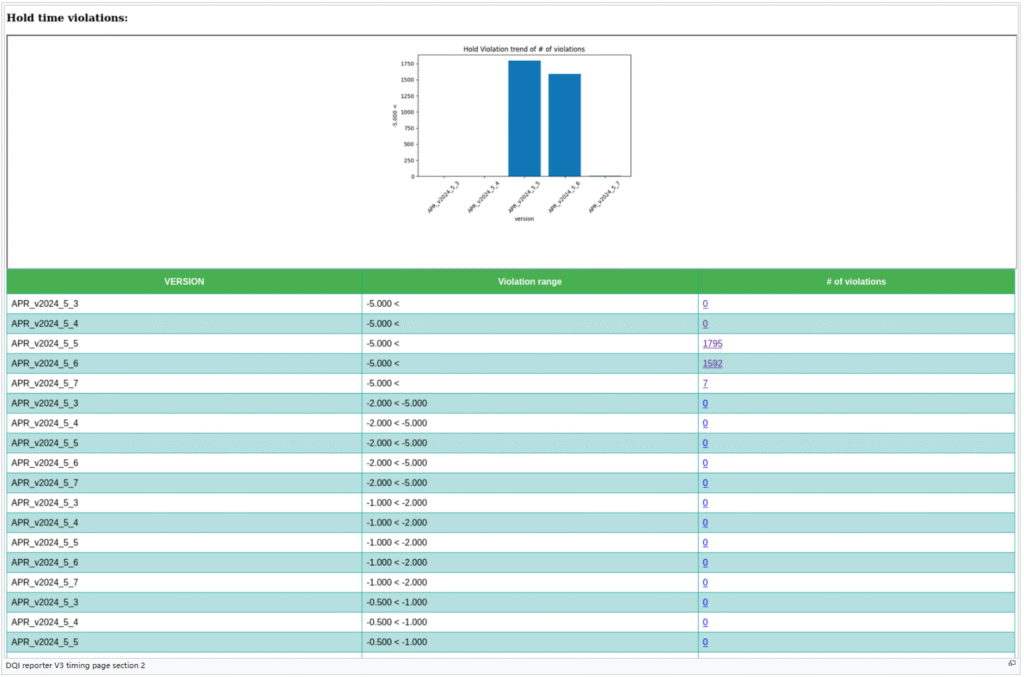

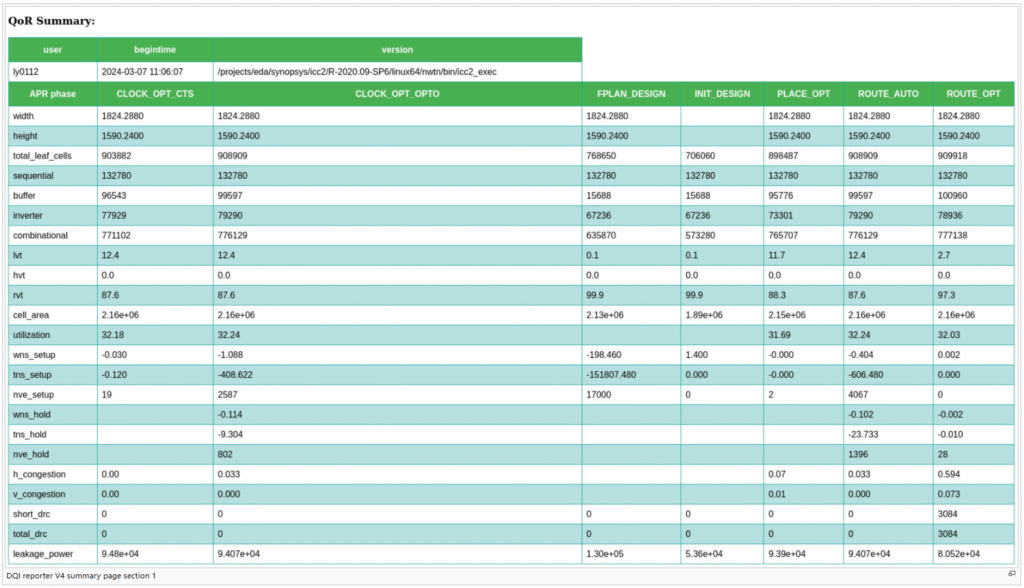
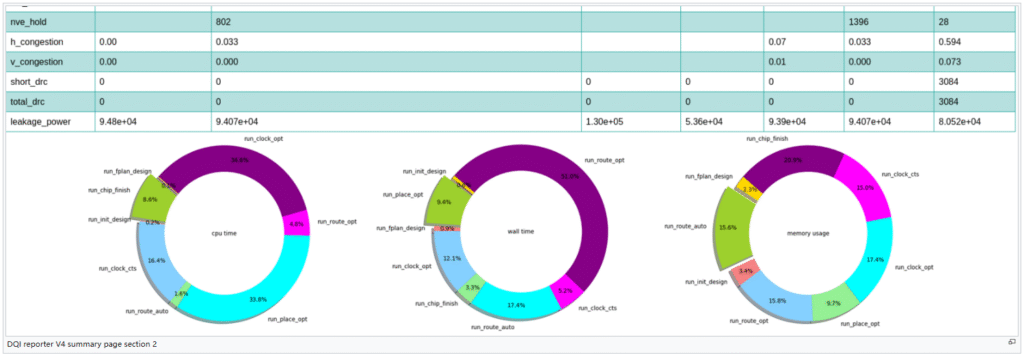
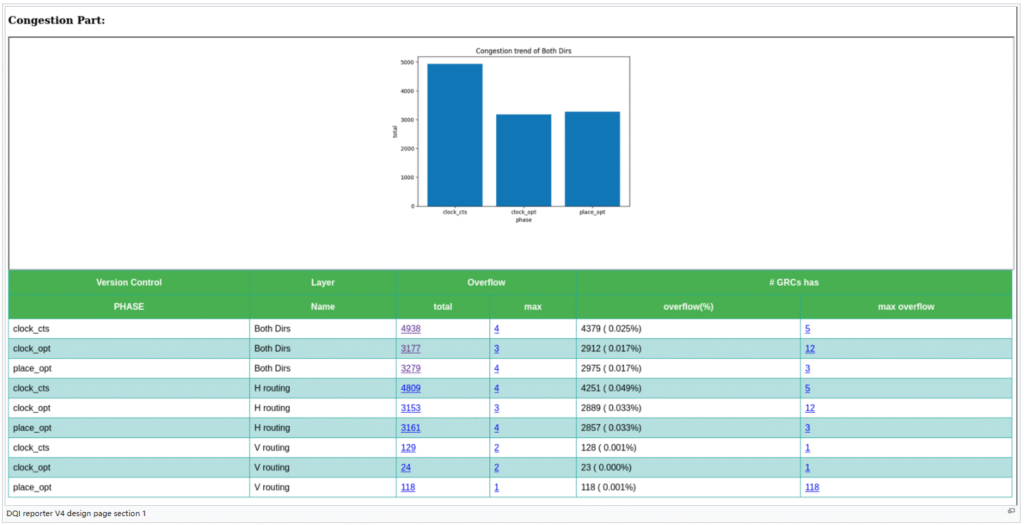
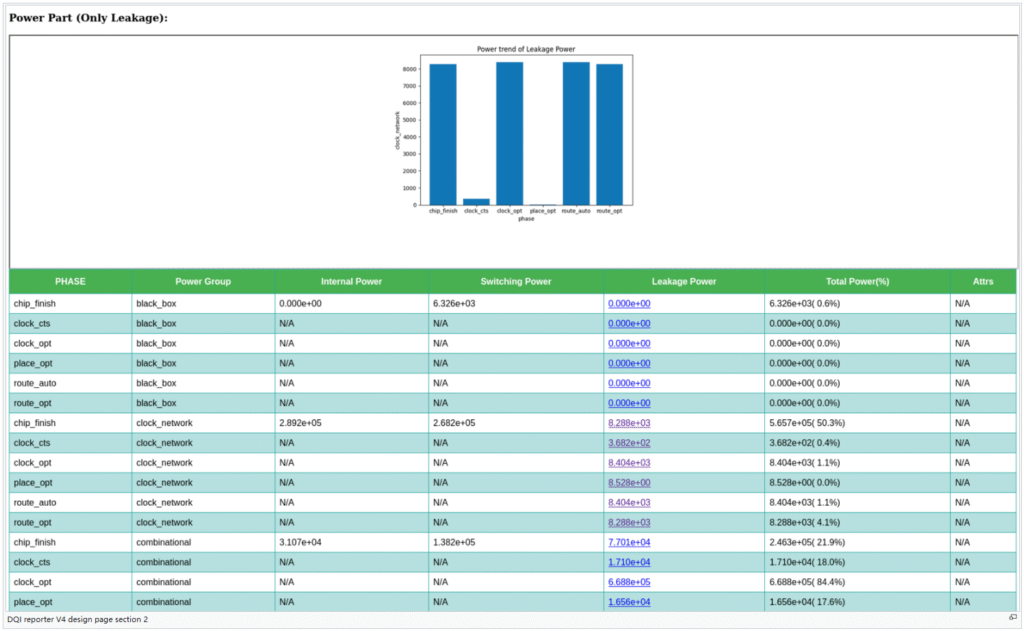
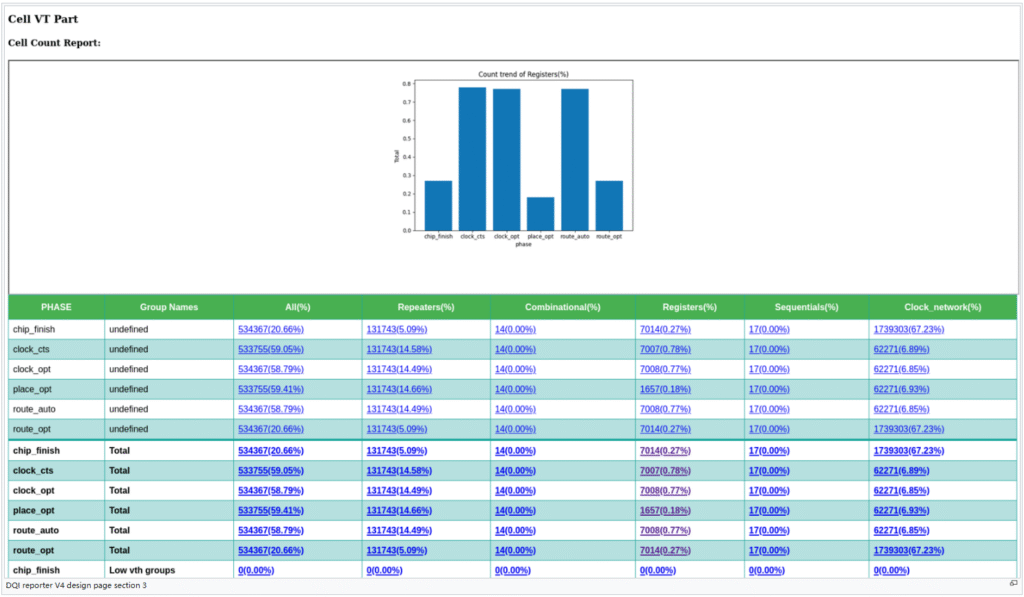
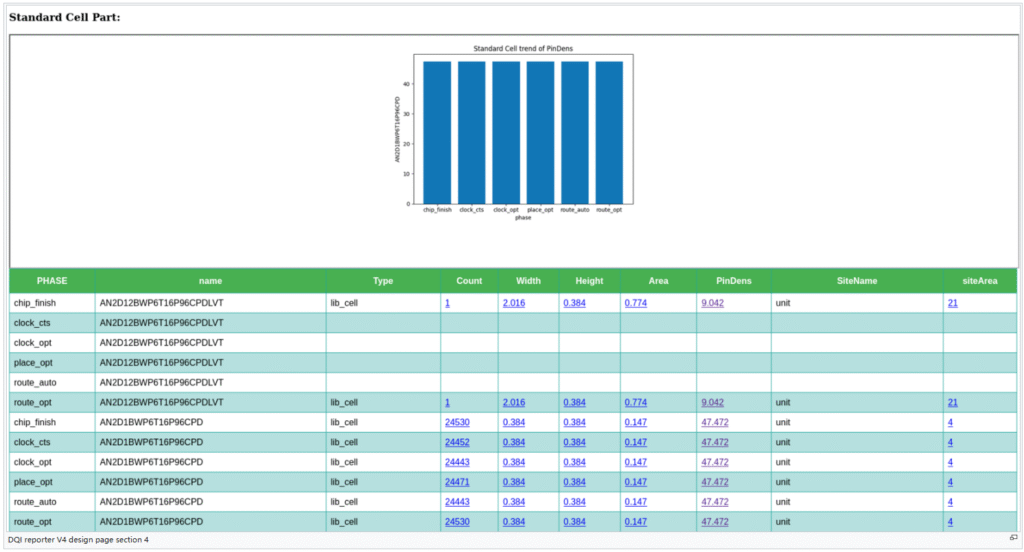
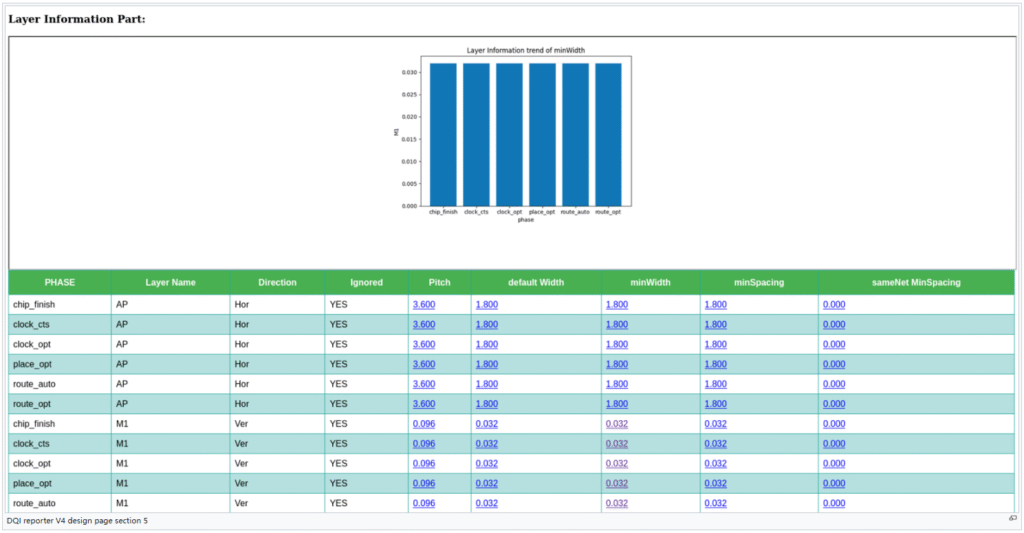
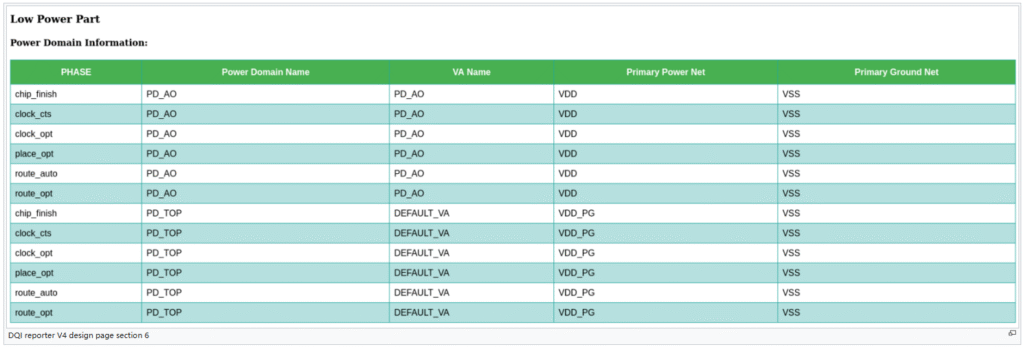
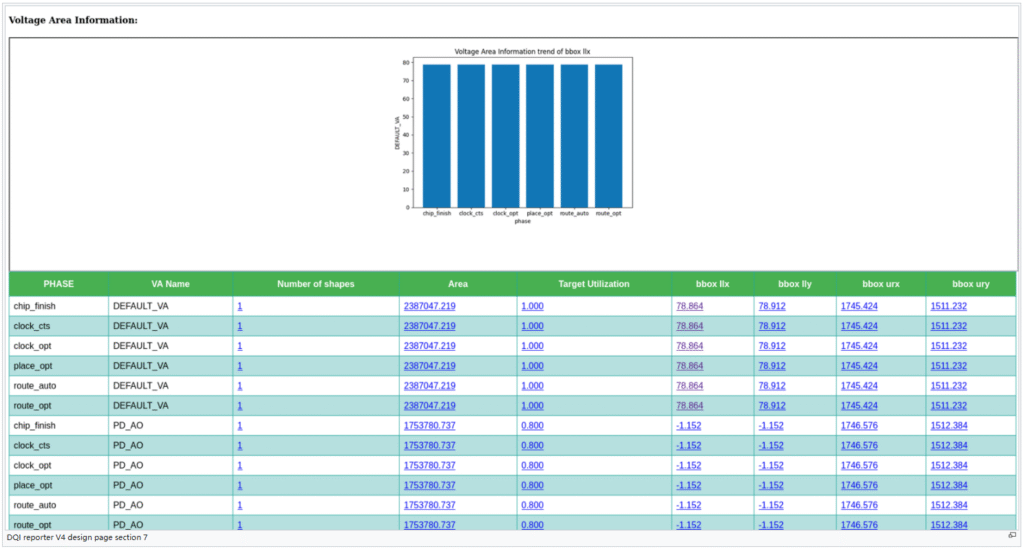
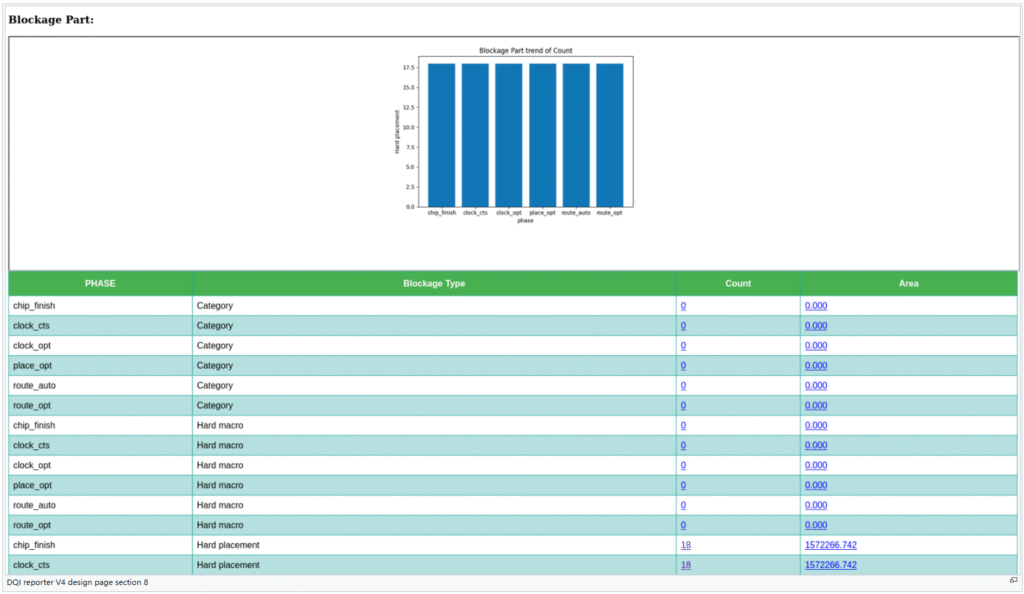
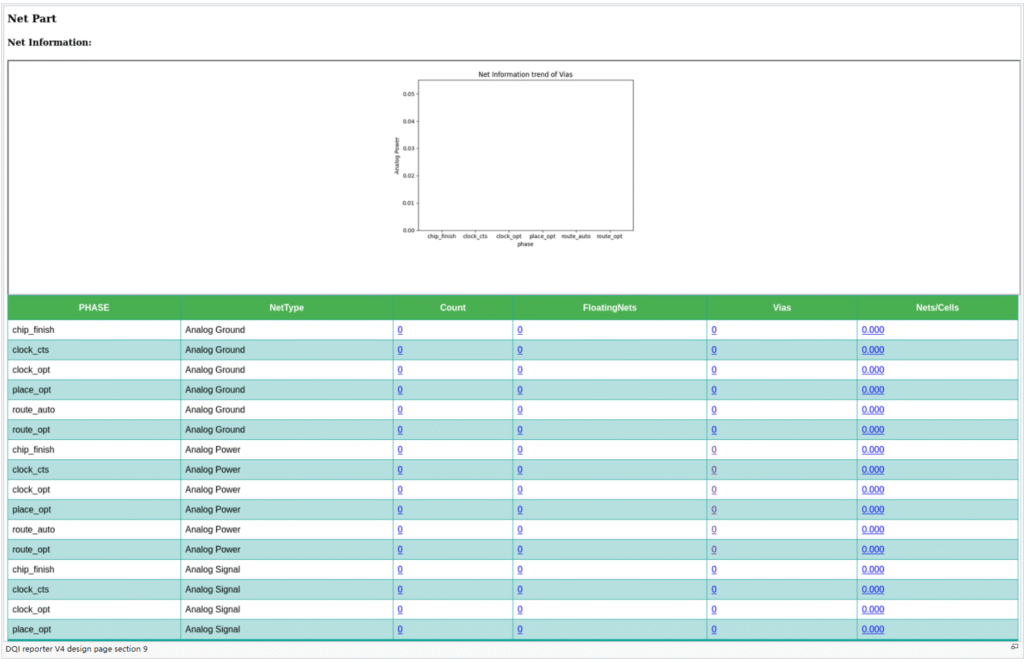
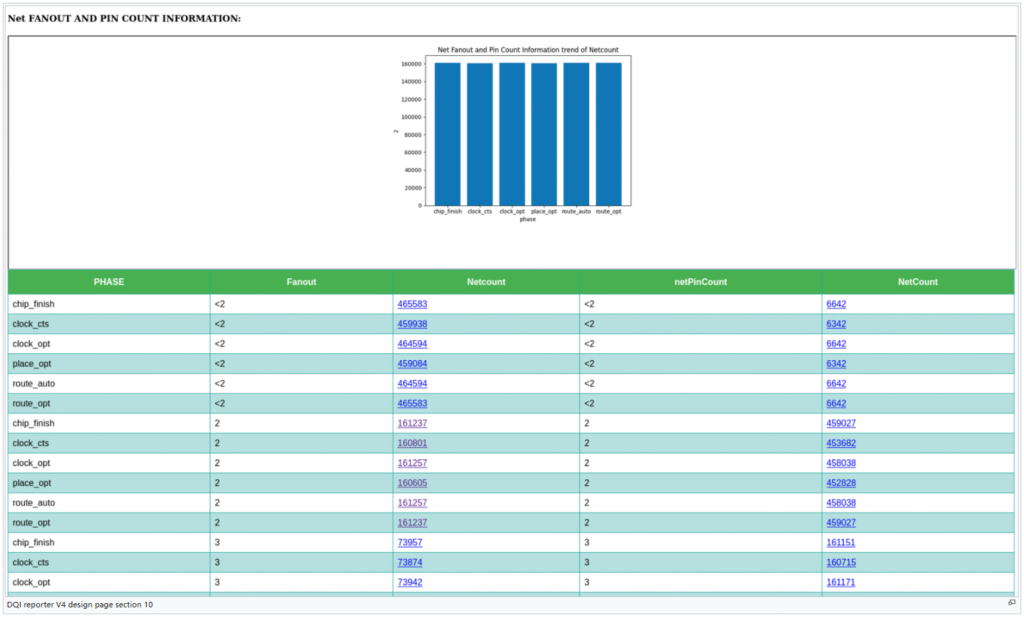
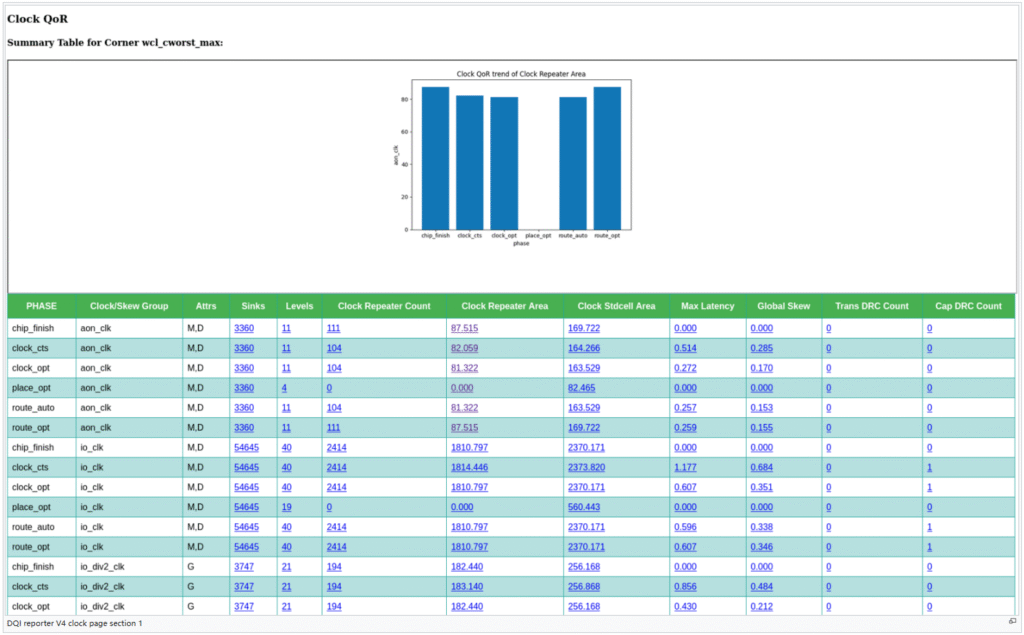
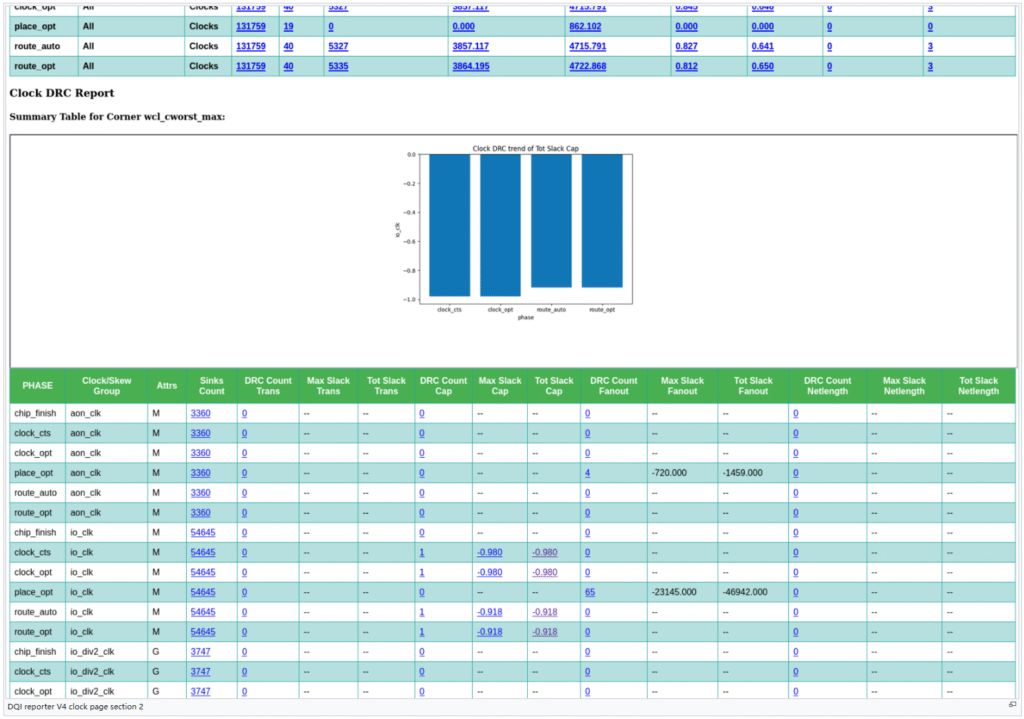
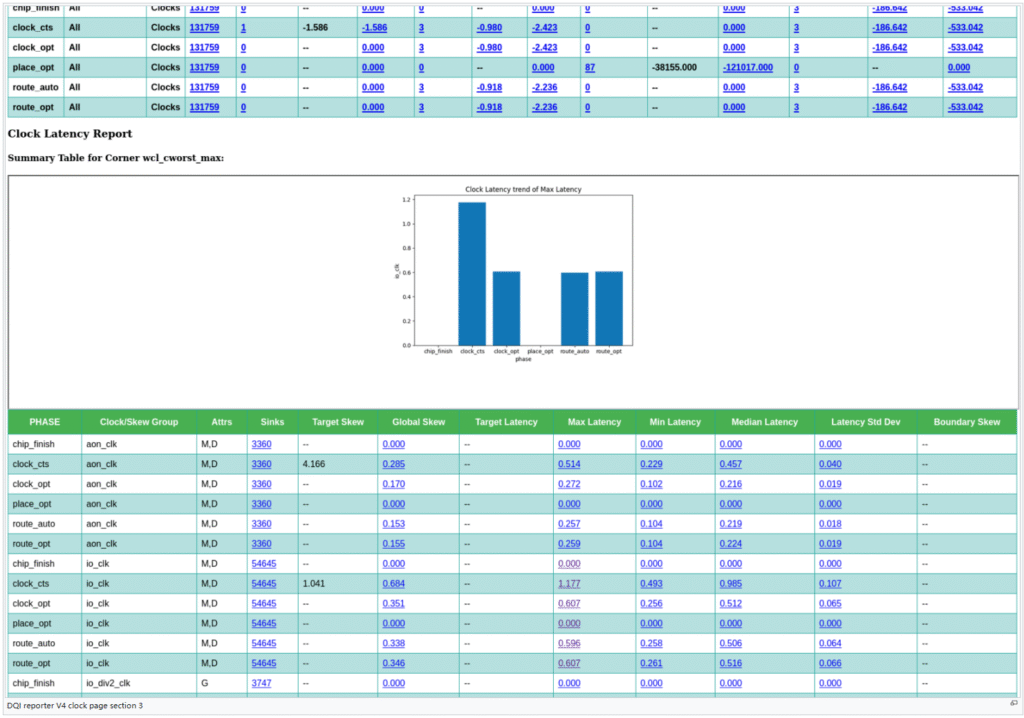
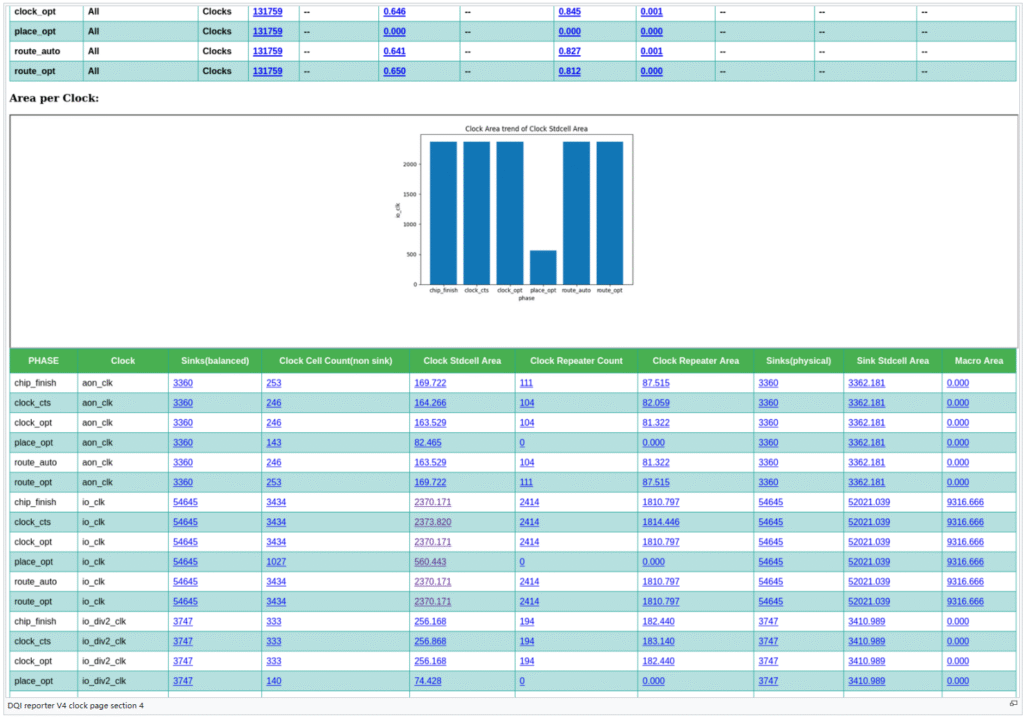
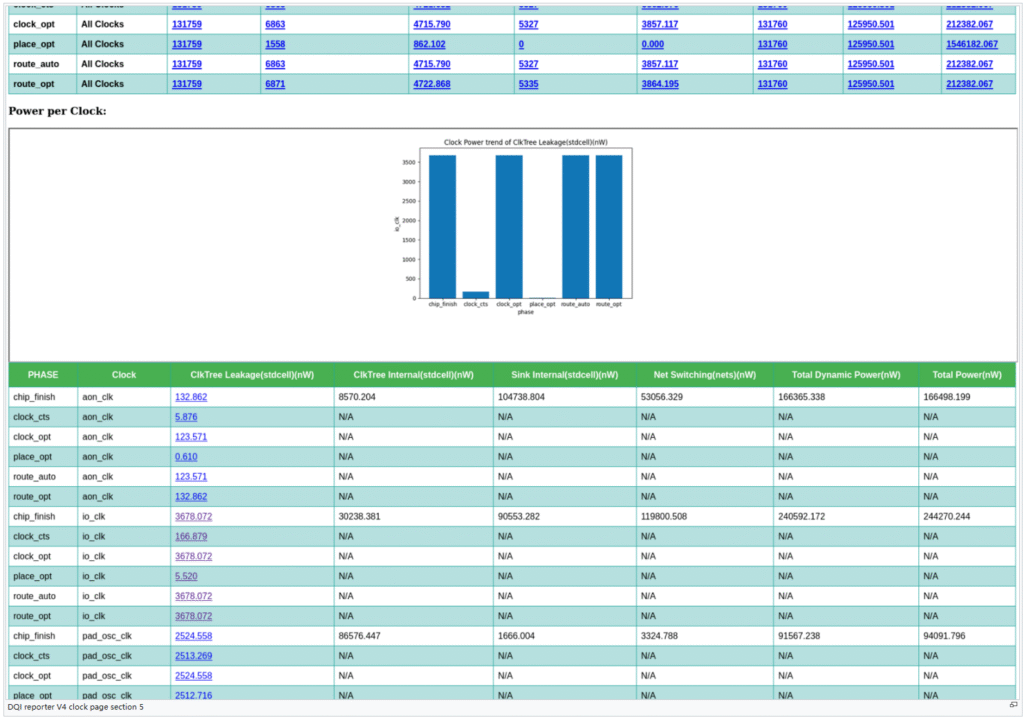
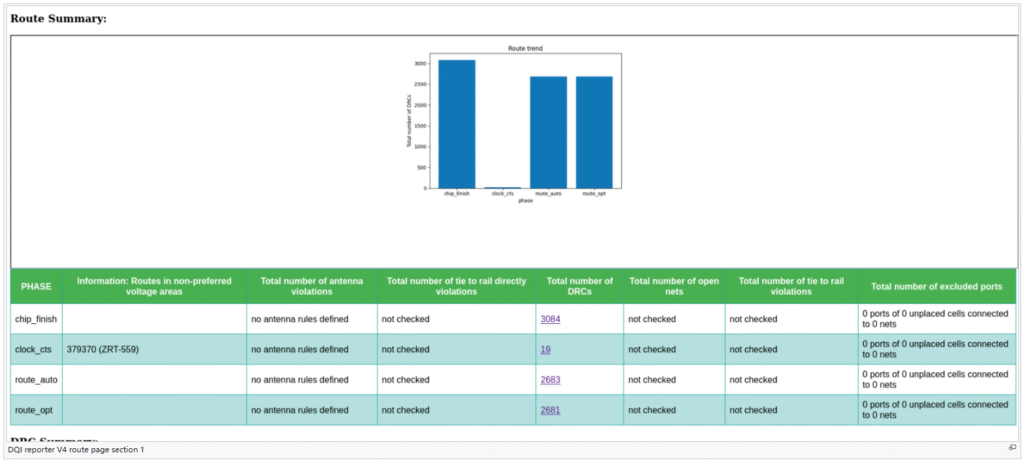
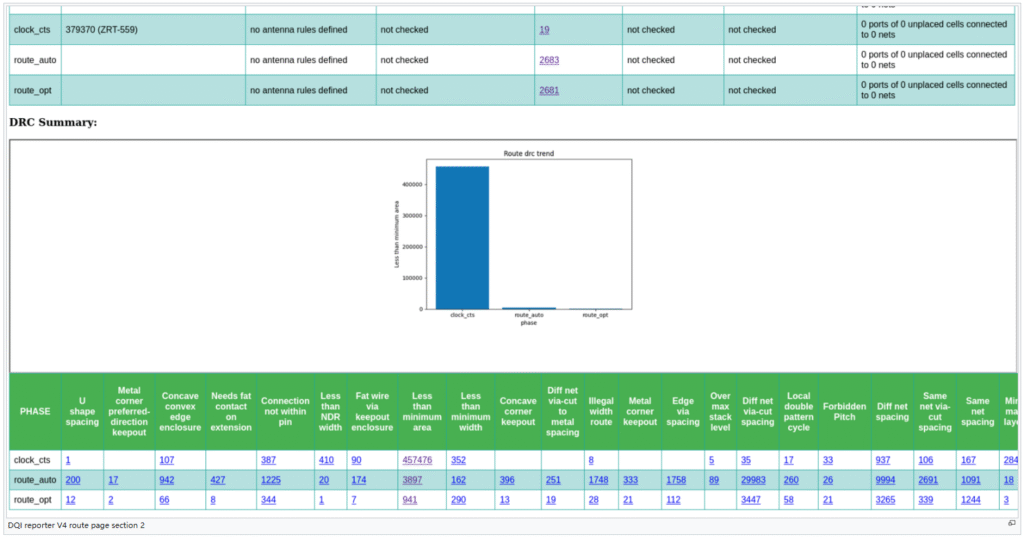
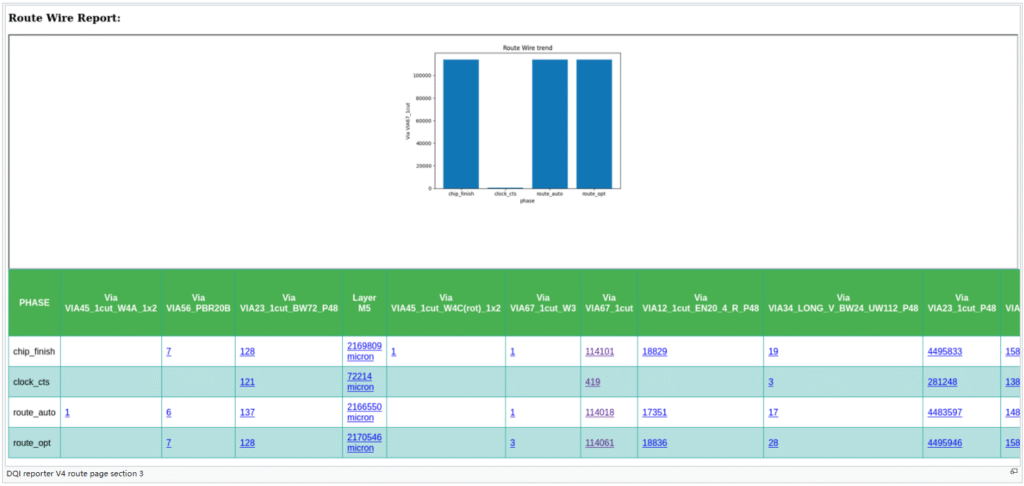
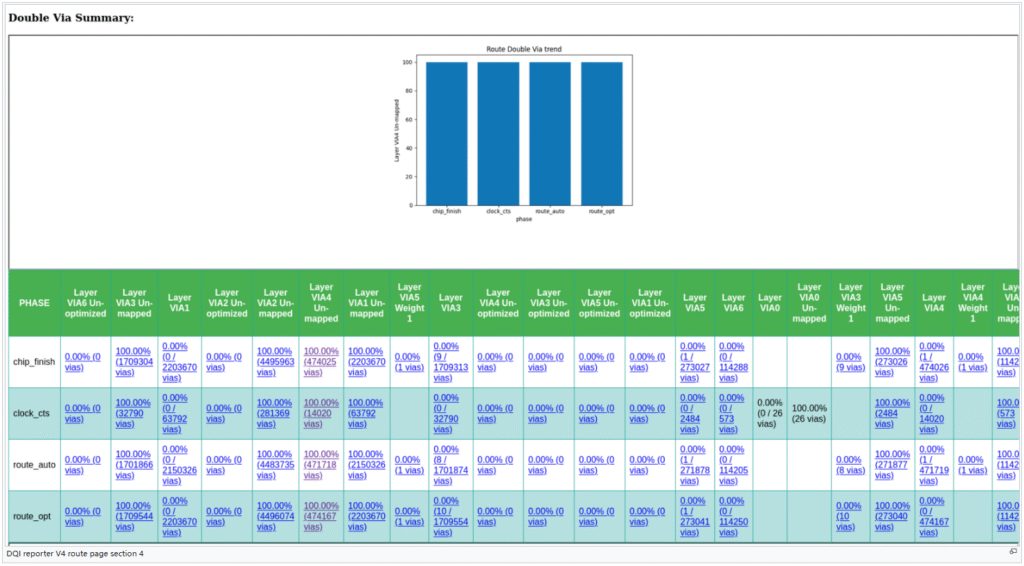
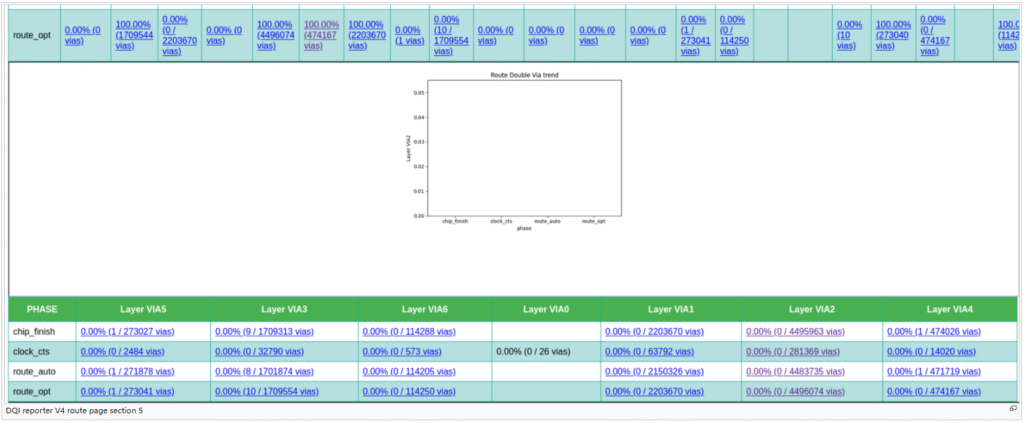
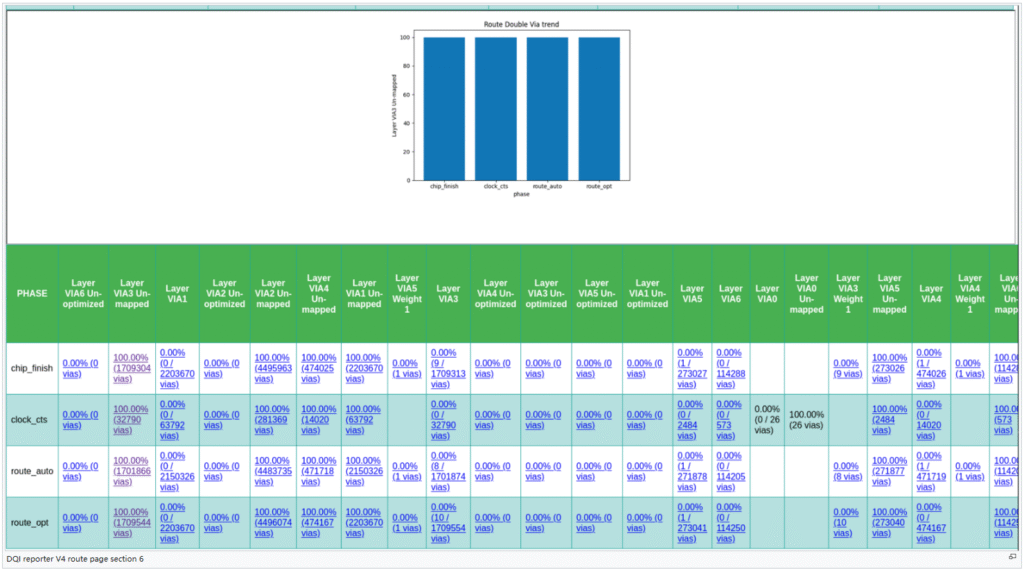
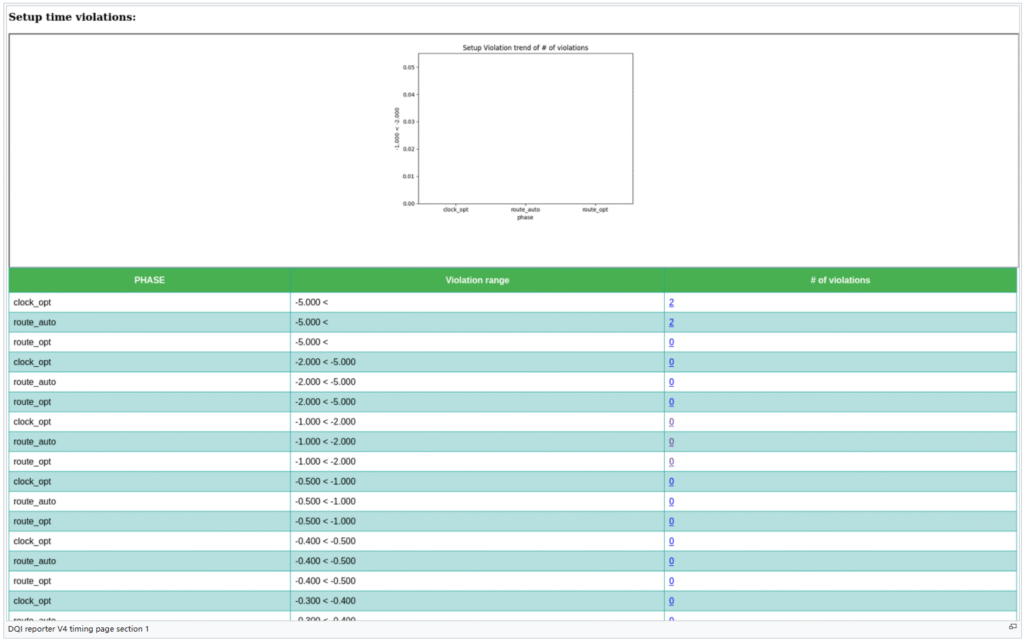
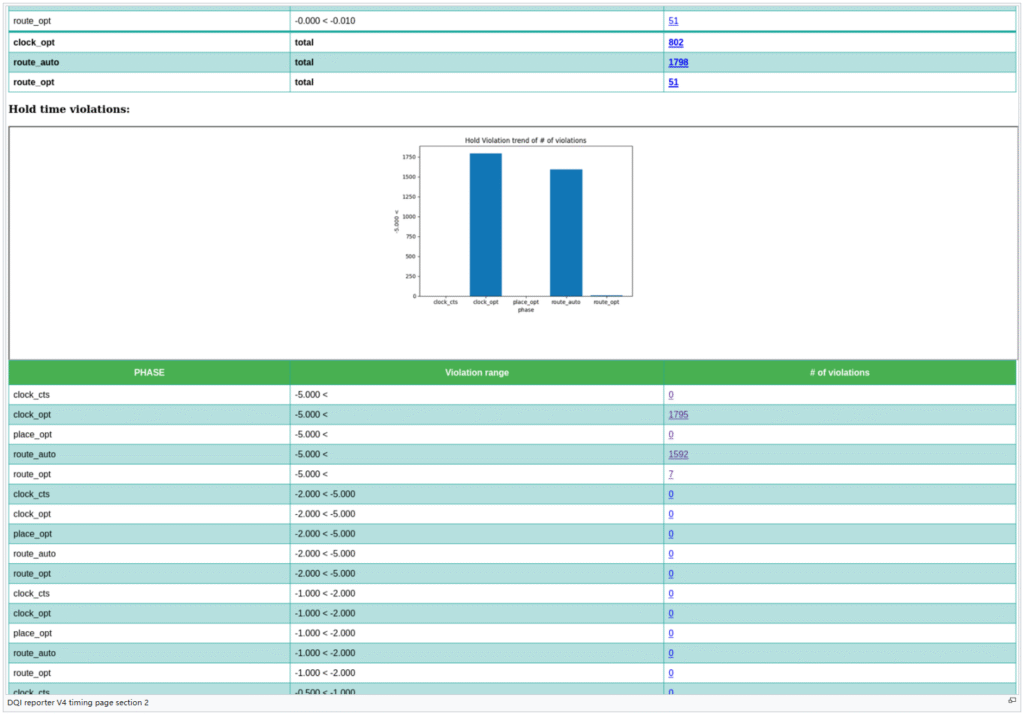
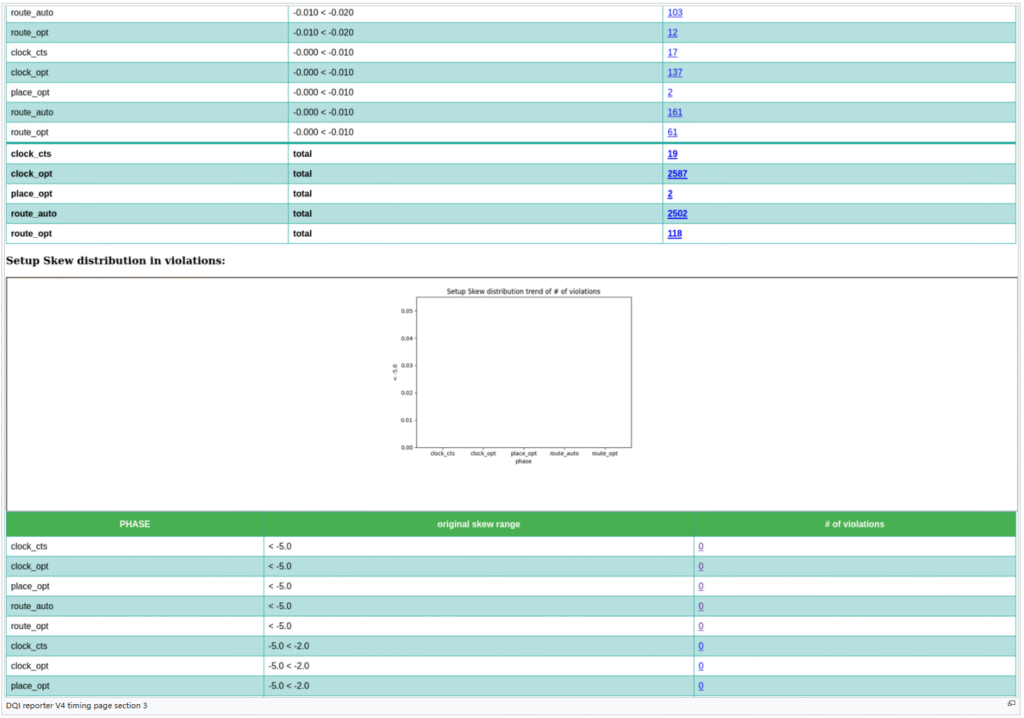
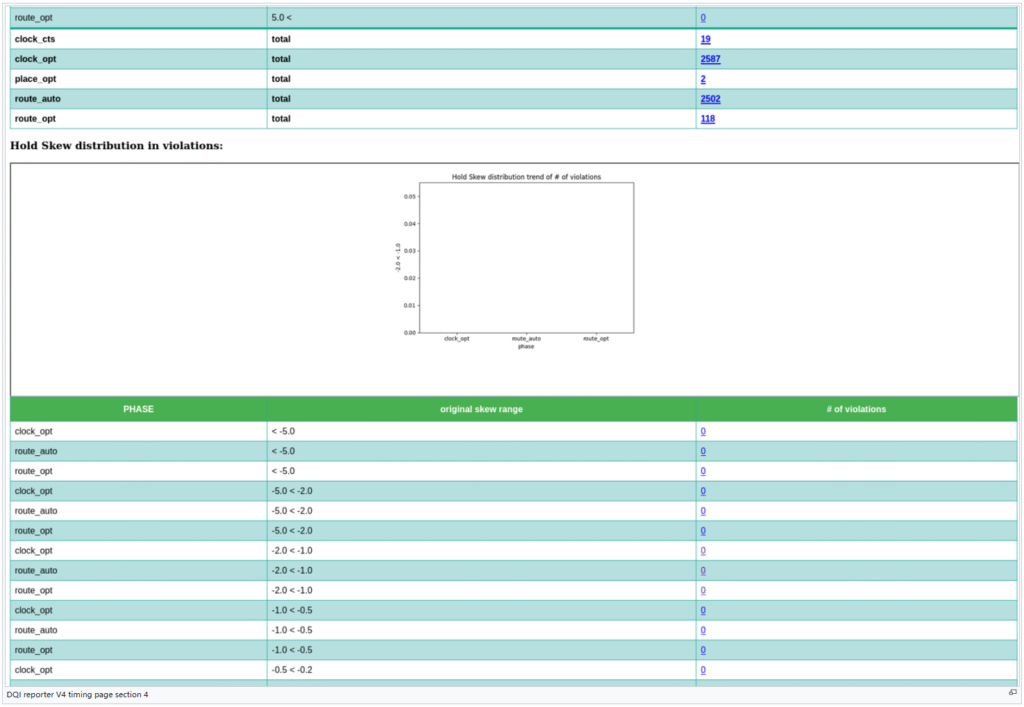
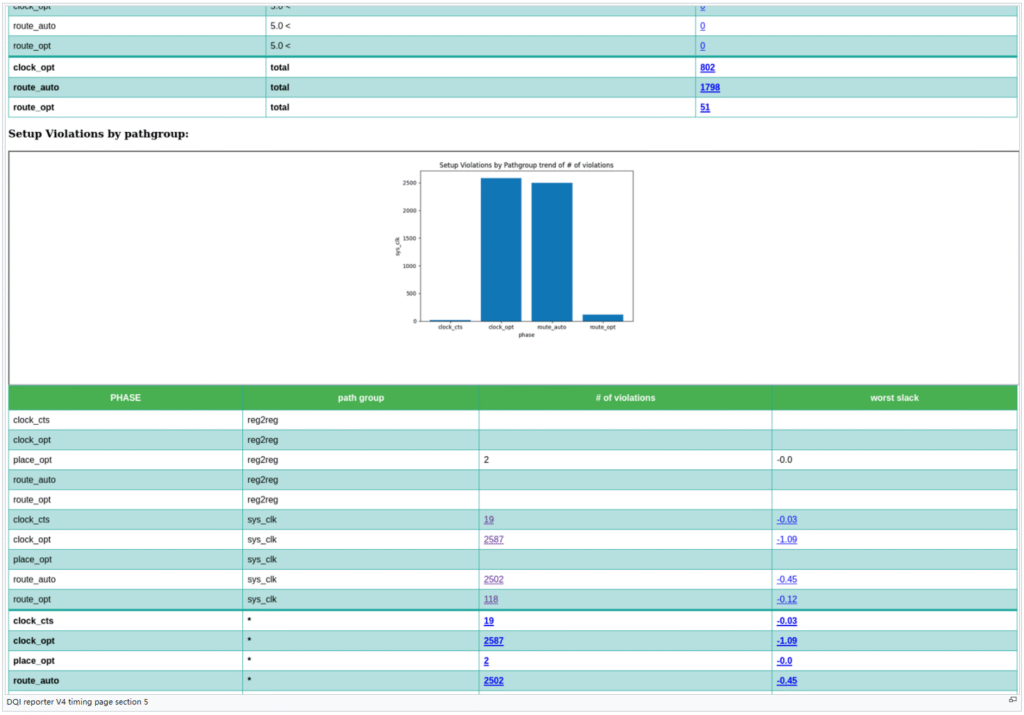
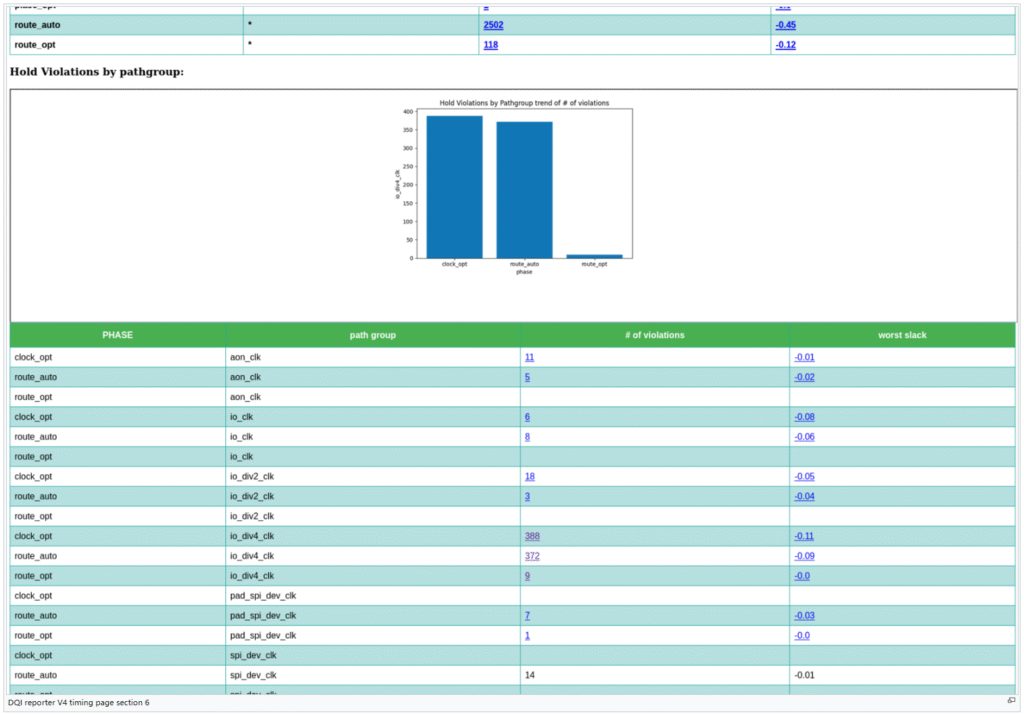
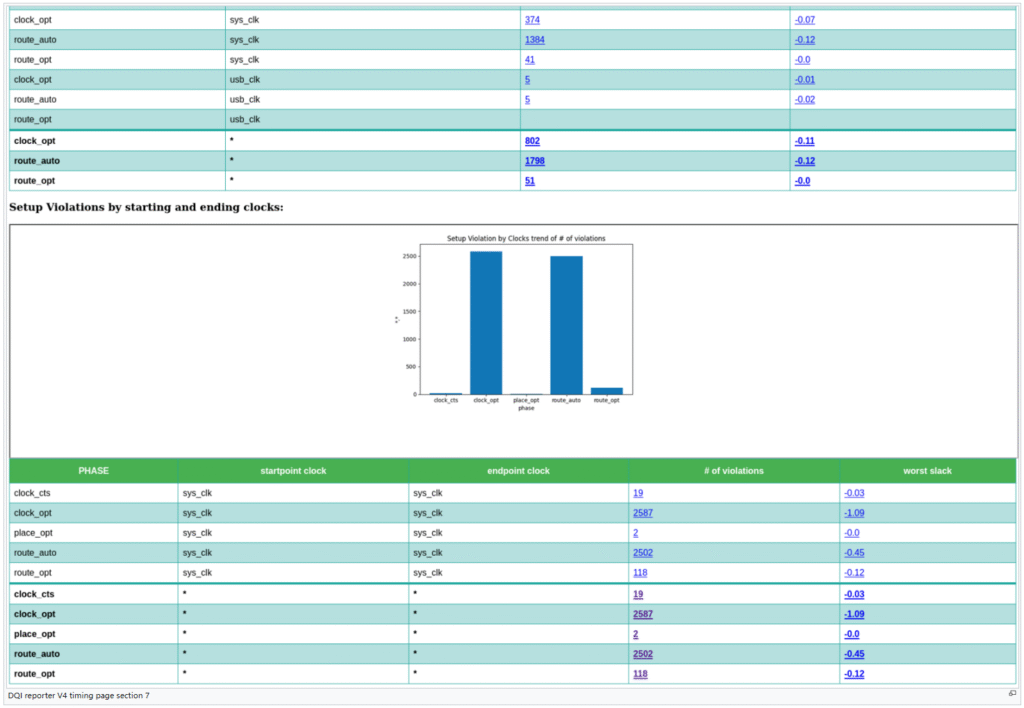
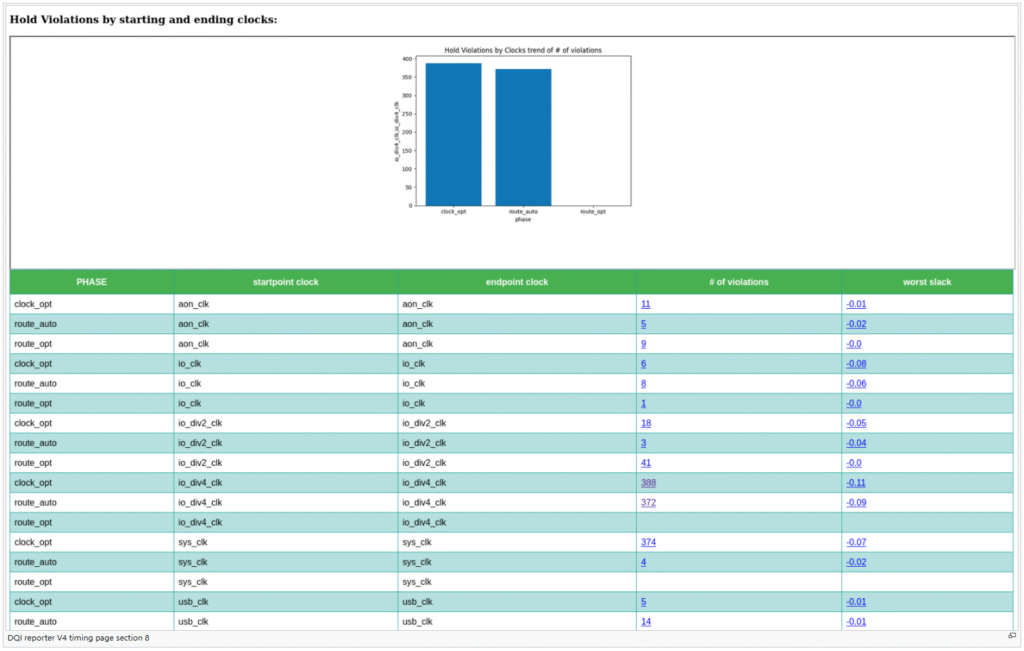
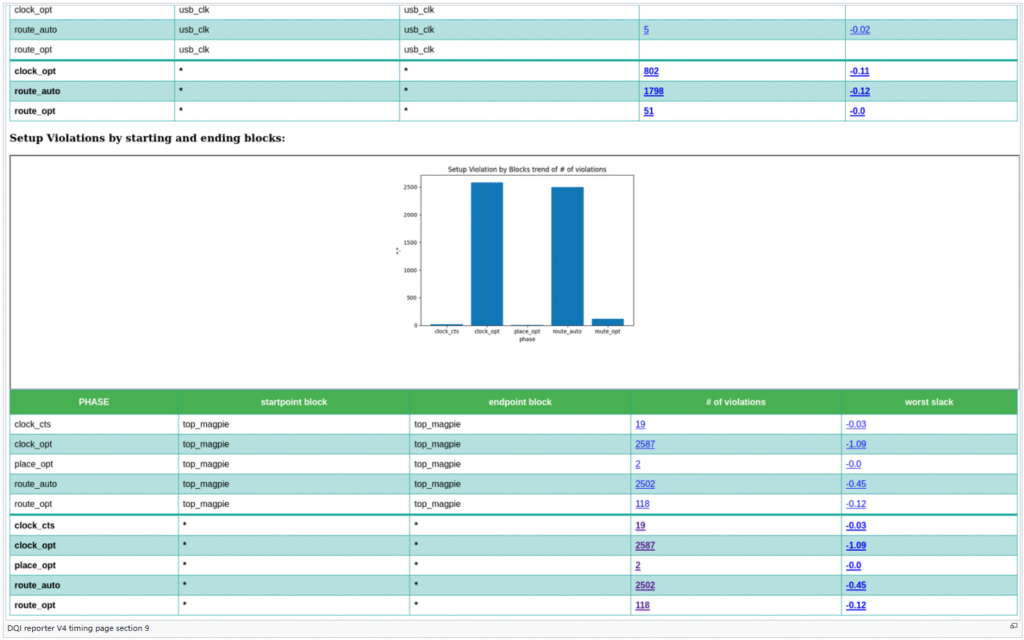
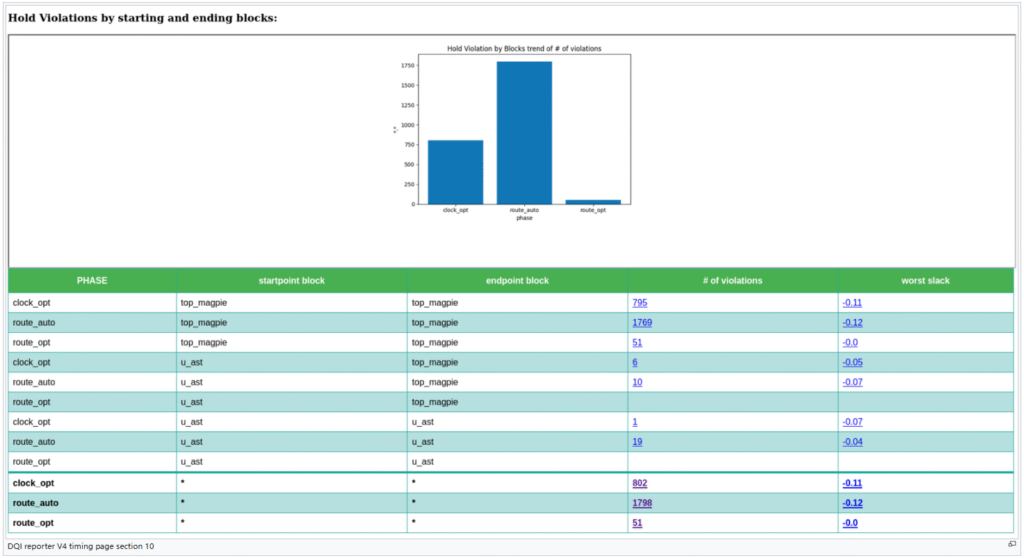
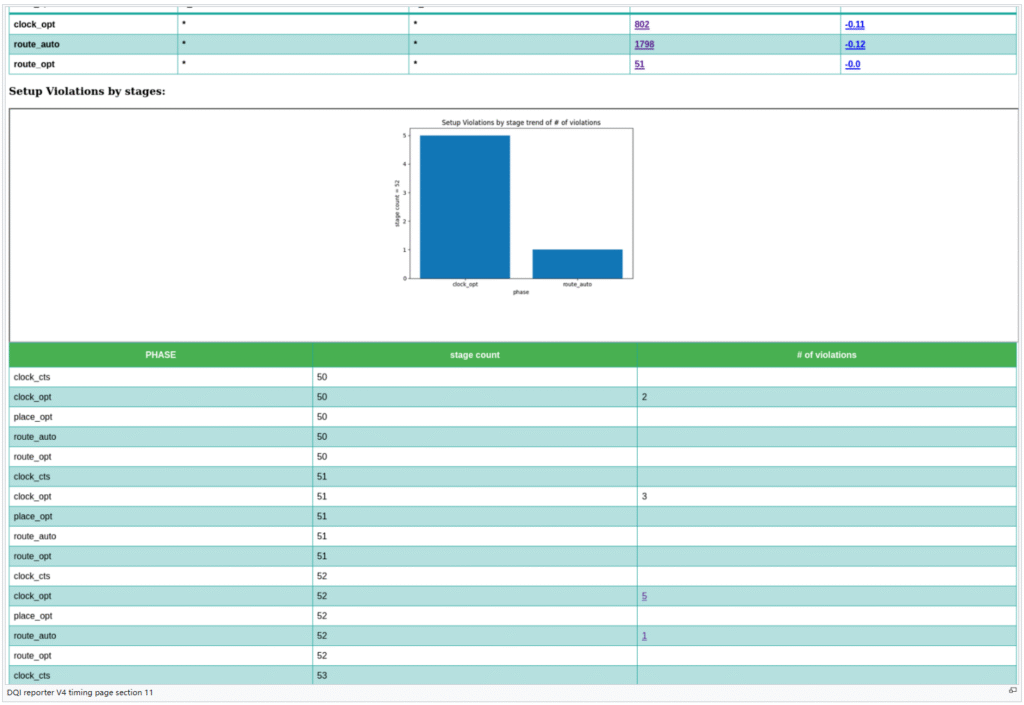
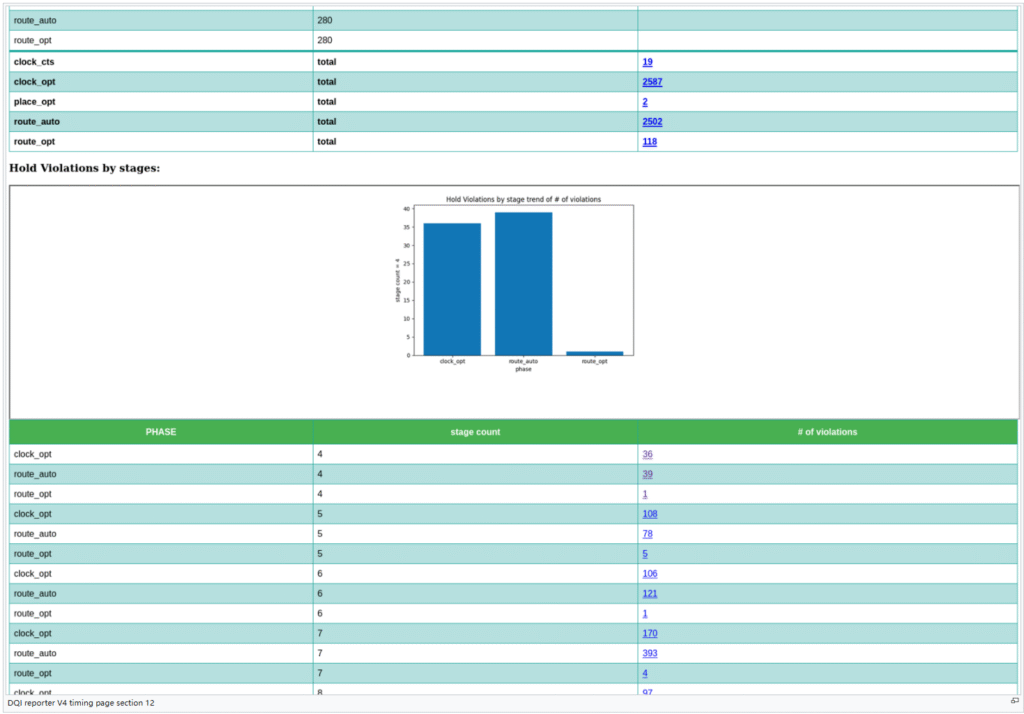
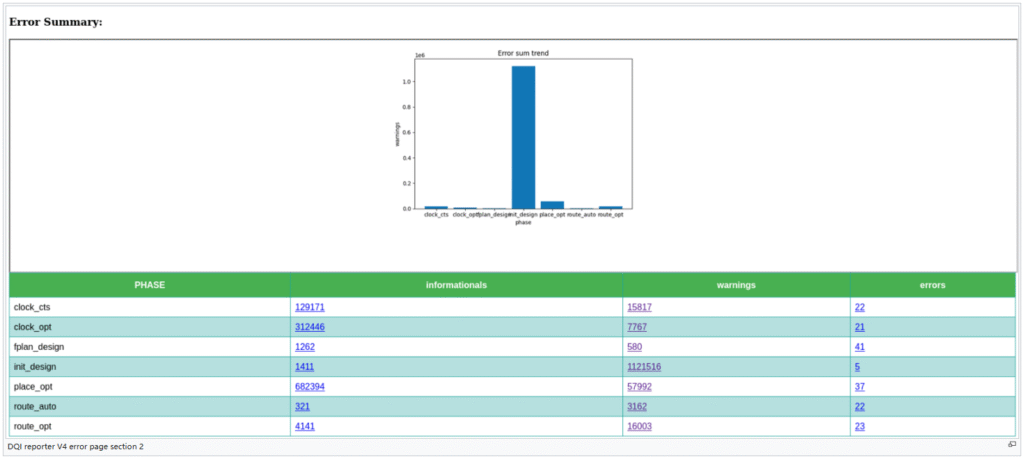
Version 4:
This version compares data from different APR phases, but in the same date (or same version). Different phases are compared in the table, trend-chart could be plotted in frames above the table. Here’s the snapshots of html reports: